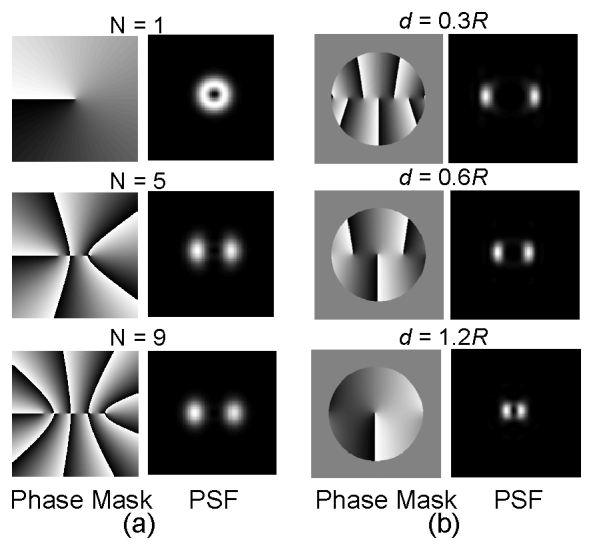
Fig. 2.

Influence on the PSF of the number and distribution of vortex singularities in the pupil function. (a) The left column shows the pupil phase function (phase mask) with an increasing number of vortex singularities N and constant spacing d between them. The corresponding in-focus PSFs are shown in the right column. (b) Shows the change in the phase mask (left) and PSF at focus (right) as the spacing d increases with a constant N = 9.
