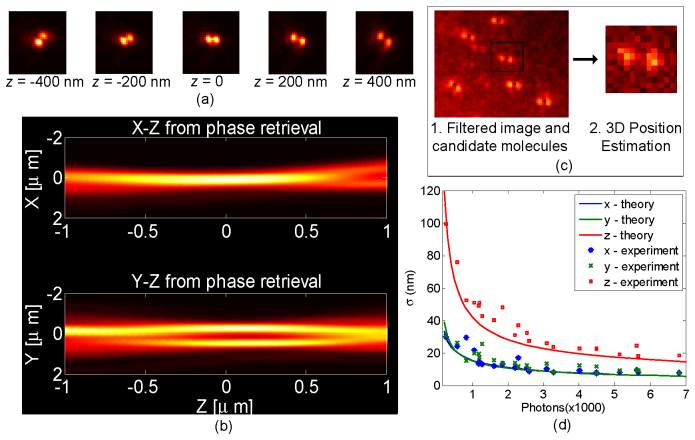
Fig. 4.
Calibration and Phase Retrieval Interpolation: (a) Images of the 3D DH-PSF for various defocus positions. This data is taken with red beads (660/680 200 nm diameter from Invitrogen) fixed on cover slide and used as calibration for SPINDLE data analysis. (b) Result of phase retrieval to create continuous 3D PSF. This is used for maximum likelihood 3D position estimation of molecules. (c) Flowchart for processing of SPINDLE data. The image from the camera is filtered and potential molecule candidates are found (marked with black asteriks). Each candidate image is passed on to the estimator to find 3D position and number of detected photons. (d) Experimentally determined precision of a fluorescent bead compared with the CRB calculated for a 1 photon/pixel background under experimental conditions (see text).

