
Fig. 10.
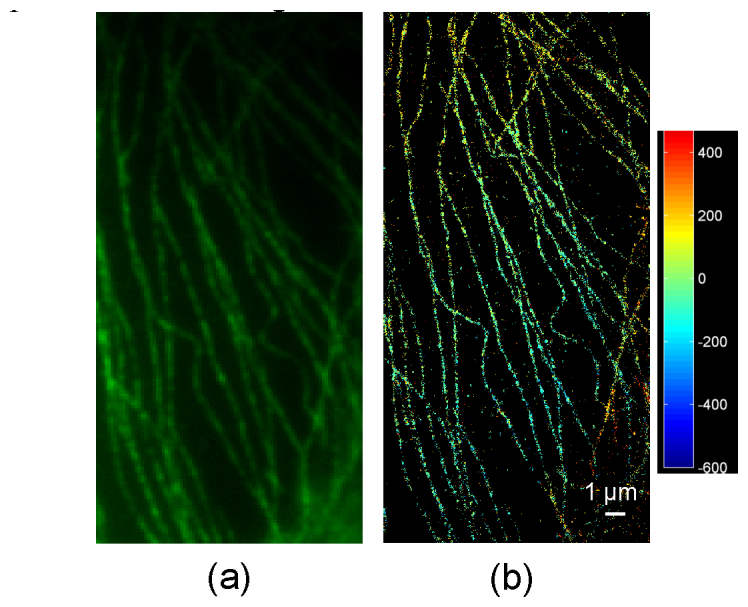
(a) Normal fluorescence image of microtubules region and (b) 3D SPINDLE image of the same region. The depth is shown in colormap.
Official websites use .gov
A
.gov website belongs to an official
government organization in the United States.
Secure .gov websites use HTTPS
A lock (
) or https:// means you've safely
connected to the .gov website. Share sensitive
information only on official, secure websites.
(a) Normal fluorescence image of microtubules region and (b) 3D SPINDLE image of the same region. The depth is shown in colormap.