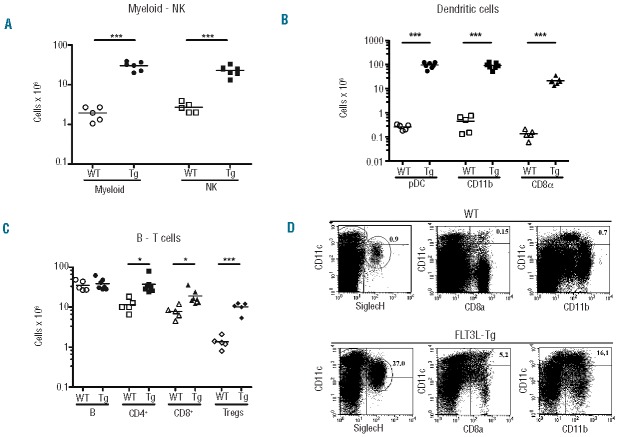
Figure 3.
Alterations in myeloid, lymphoid and dendritic cell populations in the spleens of FLT3L-Tg mice. (A) Numbers of CD11b+GR1+ myeloid and NK1.1+ natural killer (NK) cells in spleens of 8- to 14-week old WT (white symbols) and FLT3L-Tg (black symbols) mice (5 or 6 mice per group). ***P<0.0001. (B) Numbers of CD11c+SiglecH+ plasmacytoid DC (pDC), CD11c+CD11b+ conventional DC (CD11b) and CD11c+CD8α+ conventional DC (CD8α) in spleens of WT (white symbols) and FLT3L-Tg (black symbols) mice (5 or 6 mice per group). ***P<0.0001. (C) Numbers of CD19+IgM+ B cells, CD4+ T cells, CD8+ T cells and Foxp3+CD4+ regulatory T cells (Tregs) in the spleens of WT (white symbols) and FLT3L-Tg (black symbols) mice (5 or 6 mice per group). *(CD4): P=0.149, *(CD8): P=0.0192, ***P<0.0001. (D) FACS plots showing the gating strategy used for staining the DC subpopulations included in (B).

