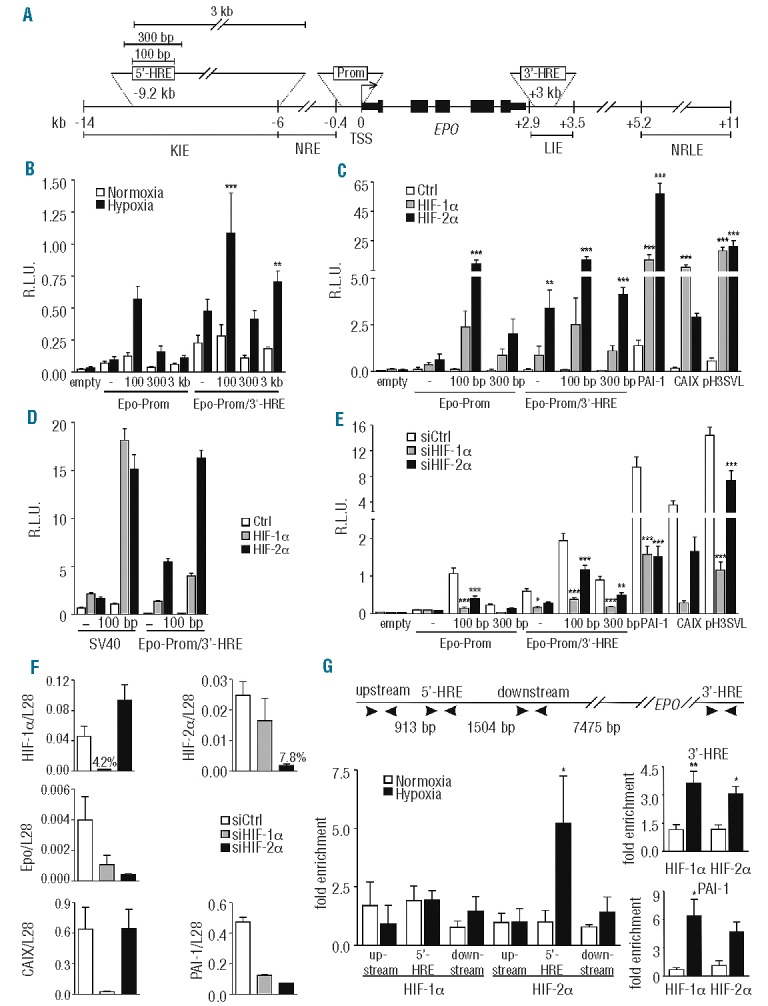
Figure 2.

HIF-2α dependent hypoxic regulation of the Epo distal enhancer element. (A) Scheme depicting the constructs used. The numbers are relative to the transcriptional start site (TSS). KIE: kidney-inducible element; NRE: negative regulatory element; LIE: liver-inducible element; NRLE: negative regulatory liver element. (B) Dual luciferase analyses using the Epo minimal promoter (117 bp) and several indicated extensions of the distal 5′-HRE alone or in combination with the 3′-HRE. All reporter gene experiments were performed as in Figure 1. (C) The indicated vectors were co-transfected with HIF-α or empty expression vectors into Hep3B cells. CAIX (carbonic anhydrase IX) and PAI-1 (plasminogen activator inhibitor 1) promoter constructs were used as controls for HIF-1α and HIF-2α specificity, respectively. pH3SVL is controlled by a concatamerized non-HIFα isoform specific HRE and an SV40 promoter. (D) Comparison between SV40-driven and Epo promoter-driven luciferase expression, following HIFα overexpression in Hep3B cells. (E) Effect of siRNA-mediated HIFα knockdown on the indicated vectors in Hep3B cells. (F) HIF-1α, HIF-2α, Epo, PAI-1 and CAIX mRNA levels were measured by RT-qPCR and normalized to ribosomal protein L28 mRNA levels. (G) Scheme depicting the different primer regions used for ChIP experiments. ChIP of normoxic or hypoxic (0.2% O2, 24 h) Hep3B cells using antibodies directed against HIF-1α or HIF-2α. The amount of co-precipitated chromatin derived from the human Epo 5′ regulatory region, its upstream and downstream regions, and the Epo 3′-HRE was determined by qPCR. The PAI-1 promoter was used as an additional positive control. Mean values ± SEM of 3 (B–F) or 4 (G) independent experiments are shown and statistical analyses were performed with one-way ANOVA and Tukey correction for multiple comparisons (*P<0.05; **P<0.01; ***P<0.001).
