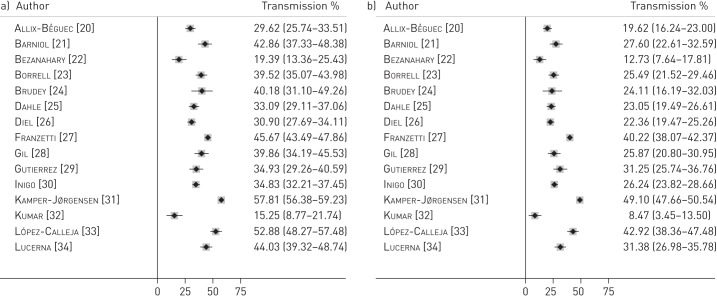
Figure 2–
Forest plots for a) proportion of all genotyped tuberculosis (TB) cases that are clustered, estimated by the n method (outcome 1a), and b) proportion of all genotyped TB cases that resulted from recent transmission, estimated by the n-1 method (outcome 1b). Data are presented with 95% confidence intervals.

