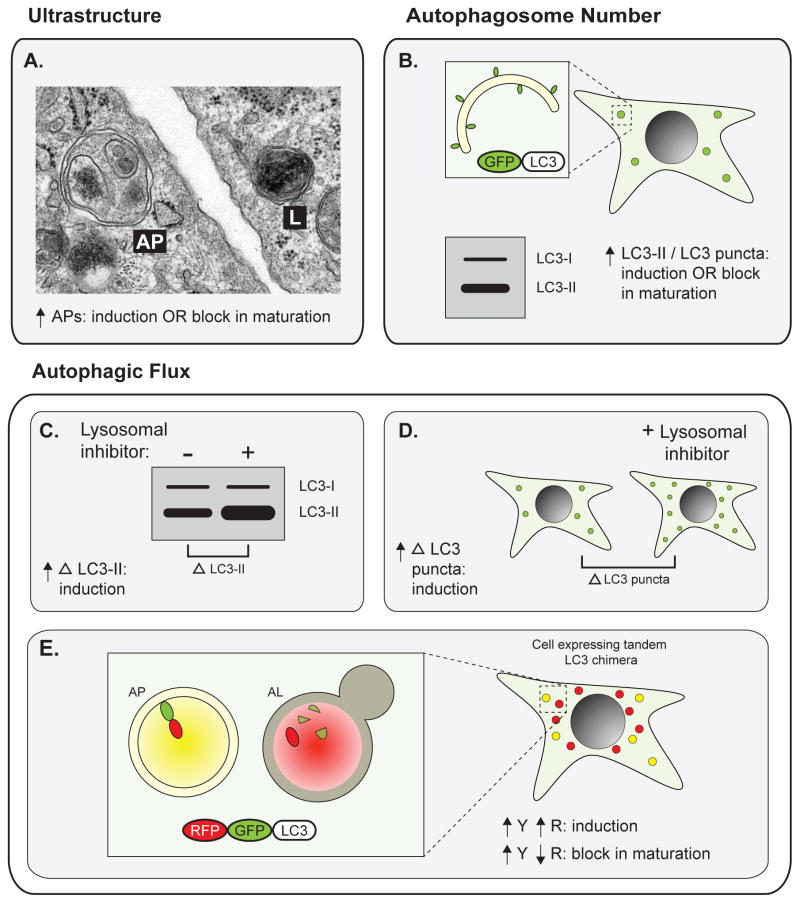
Figure 2. Methods for monitoring autophagy.
Early studies implicating autophagy in disease primarily measured total autophagosome number, either (A) by identification of APs and ALs by electron microscopy or (B) by measuring total levels of lipidated LC3 (LC3-II) or number of LC3 puncta (which mark APs) in cells expressing GFP-tagged LC3 (GFP-LC3). Importantly, in both of these cases, an increase in APs can indicate either autophagy induction or a block in AP maturation. Autophagic flux assays more directly measure total autophagic activity. In the presence of lysosomal inhibitors, (C) increased accumulation of lipidated LC3 or (D) increased accumulation of GFP-LC3 puncta indicates autophagic induction. (E) In cells expressing tandem RFP-GFP-tagged LC3, APs are identified as yellow puncta and ALs are detected as red puncta following quenching of GFP fluorescence in the lysosome. An increase in both signals indicates autophagic induction, whereas an increase in yellow with a decrease in red indicates a block in maturation. Abbreviations: AP, autophagosome; AL, autolysosome; LC3-I, non-lipidated LC3; LC3-II, lipidated LC3; Δ LC3-II, accumulation of lipidated LC3; Δ LC3 puncta, accumulation of GFP-LC3 puncta; Y, yellow; R, red.

