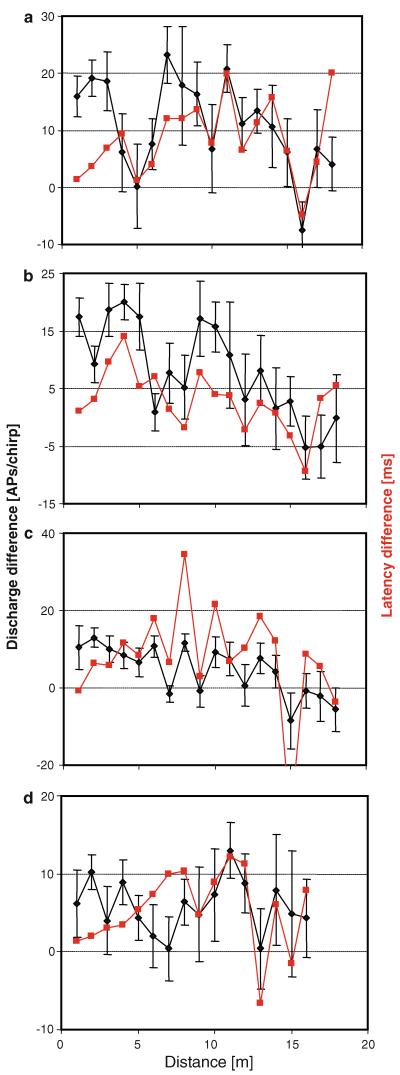
Fig. 7.
a–d Bilateral AN1 discharge differences (black) and binaural latency differences (red) in four preparations at different distances (mean of 10 responses per stimulus ± SD; SD of latency differences were very large and are not demonstrated for clarity). Negative values indicate either stronger responses or responses with shorter latencies for the contralateral AN1 neuron. Note the existence of local minima and maxima, where directional information is either low or high

