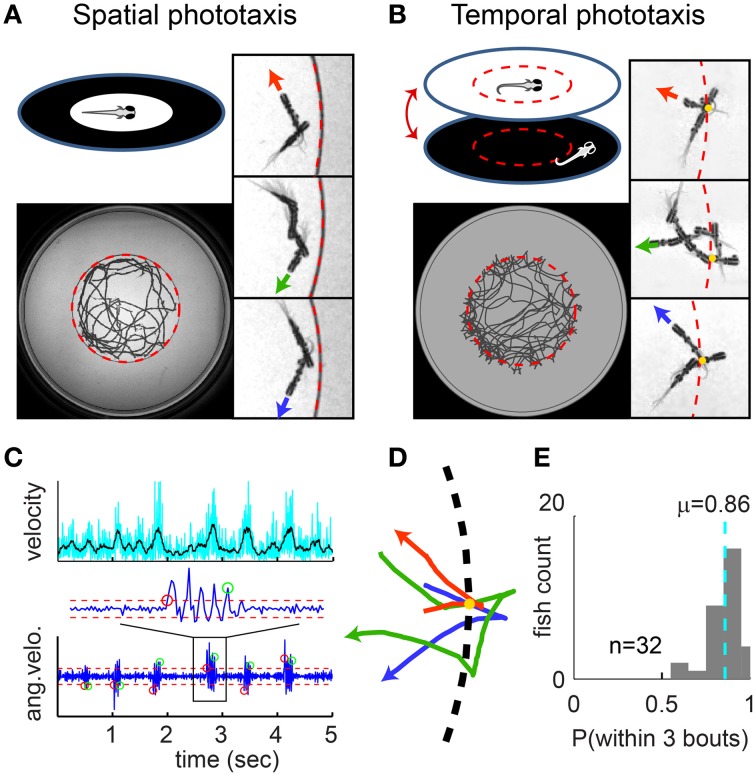
Figure 1.
Spatial vs. temporal phototaxis. (A) Larval zebrafish prefer light over darkness in the spatial comparison assay. Upper left: a diffusive (scattering) white screen surrounded by an opaque black ring is placed beneath the arena (a transparent dish) and illuminated from below. Lower left: the full trajectory of a fish over a session of 8 min. Right panels: close-up views of trajectory segments close to the border. Three example segments are shown (rotated into the same orientation), with swim direction indicated by the red, green, and blue arrowheads; circular border indicated by the dashed red line. Note that the fish does not cross the border. (B) Temporal comparison assay, i.e., the Virtual Circle (VC) assay. The uniform illumination is turned off when the fish exits the virtual circle (dashed red circle, invisible to fish), and turned on again when the fish returns. Close-up view as in (A), additionally with yellow dots marking the point where the fish exits the virtual circle. (C) Larval zebrafish swim in distinct bouts. Upper panel: velocity of the fish over time. Lower panel: bouts are determined by thresholding the angular velocity (i.e., per-frame change of heading angle); red/green circles mark the start/end of bouts, dashed red lines mark the thresholds. (D) Trajectory segments close to the virtual border are extracted from the VC assay, with the point where fish exits the border aligned to the yellow dot. Three example segments are shown in red, green and blue, with swim direction indicated by arrowhead. (E) The probability of each fish returning to light within 3 bouts of exiting the virtual circle, summarized as a histogram for all 32 fish. Dashed cyan line indicates population mean.

