Figure 2.
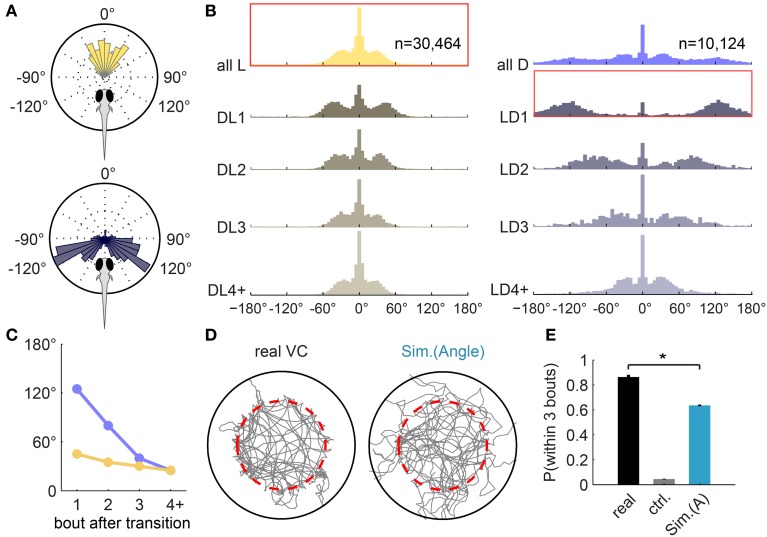
Turning-angle distributions in the light, in the dark, and at transitions. (A) Turning-angle distributions from an example fish. Upper panel: all turns in light. Lower panel: the first turn after the Light-to-Dark transition (LD1) is usually a large angle turn. (B) Turning-angle distributions from all 32 fish, for bouts in light (left panel) and in dark (right panel). The top two histograms summarize all turns made in light (left) and in dark (right), respectively. “DLn”: the n-th turn after a Dark-to-Light transition. DL4+: all subsequent turns in the dark. “LD”: respective turns in response to a Light-to-Dark transition. Histograms framed in red correspond to the single-fish polar plots in (A). (C) Mean turning angle—after excluding center peaks—of the n-th turn after transitions, extracted from (B). (D) Example trajectories of real and simulated sessions (using Algorithm I [Angle], i.e., turning-angle distributions in B) for the Virtual Circle assay. Fish trajectory is shown in gray; dashed red circle marks the virtual border. Traces after the fish reached the edge of the arena and before it returned to within the virtual borders are not shown (see Materials and Methods). (E) The average probability of returning to light within 3 bouts of exiting the virtual circle (similar to Figure 1E), compared between real fish (n = 32), a control simulation (“ctrl,” n = 100) that implements a generic turning-angle distribution pooled from all turns, and the simulation (n = 100). [Mean ± s.e.m, *p < 0.001 (paired t-test) for all pairs].

