FIGURE 1.
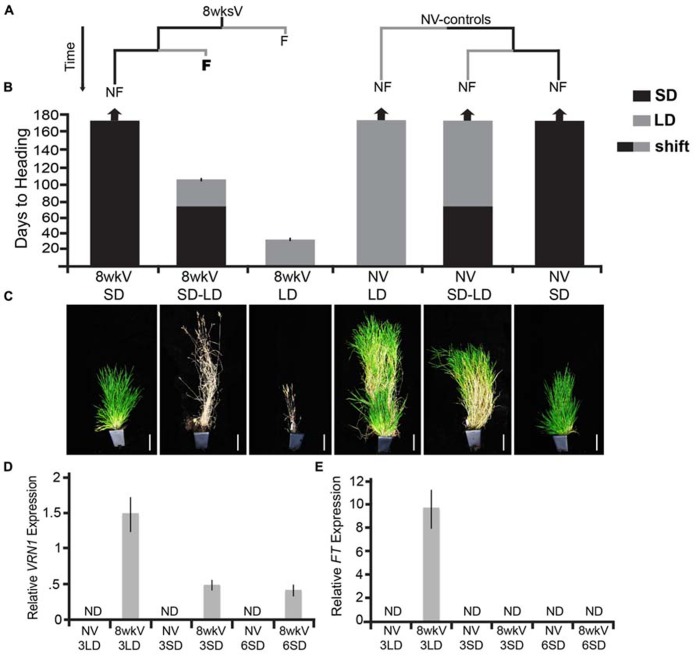
The vernalization response is mitotically stable in Brachypodium distachyon (Bd29-1). (A) Plants were exposed to either 8 weeks of cold to saturate the vernalization response (8wksV) or were non-vernalized (NV-controls). Both the 8wksV and NV treated plants were placed either into inductive 20-h long days (LD; indicated by the gray bar) or non-inductive 8-h short days (SD; indicated by the black bar). After 70 days, some of the plants that had been in SD were shifted into LD, and, as a control the remainder of the SD-grown plants were kept in SD for the duration of the experiment. Only vernalized plants flowered in LD indicated by the letter F (flower); plants that did not flower are indicated by NF (non-flowering). (B) Days to heading was measured as the number of days to first spikelet emergence as done in Ream et al. (2014). Note that time during vernalization treatment is excluded. Arrows at the top of the bar graph indicate plants that did not flower for the duration of the experiment (170 days). Black bars represent SD-grown plants; gray bars represent LD-grown plants and bars with black and gray represent those plants that were first exposed to SD for 70 days followed by a shift into LD (SD–LD). Bars represent the days to heading average of six plants (experiment was repeated with similar results). (C) Photographs of representative plants at the end of experiment. Plants were grown and scored as described in Ream et al. (2014). Scale bar = 9 cm. (D,E) VRN1 and FT expression in a newly expanded 3rd leaf and 6th leaf of Bd29-1. Imbibed seeds in soil were exposed to either a saturating cold treatment (5°C for 8 weeks) or no cold. At the end of cold treatment, non-vernalized and cold-treated plants were grown in SD and LD for ~3 weeks (3LD, 3SD) and SD for an additional ~6 weeks (6SD) at 22°C during the light phase and 18°C during the dark phase until plants reached the third leaf stage and the sixth leaf stage (Note vernalized 29-1 in LD had flowered by 5 weeks so did not sample 6LD). VRN1 and FT transcript levels were determined byRT-qPCR as described in Ream et al. (2014) and normalized to UBIQUITIN-CONJUGATING ENZYME18. ND denotes no expression detected. Bars represent the average of four biological replicates ± standard deviation (three leaves per replicate).

