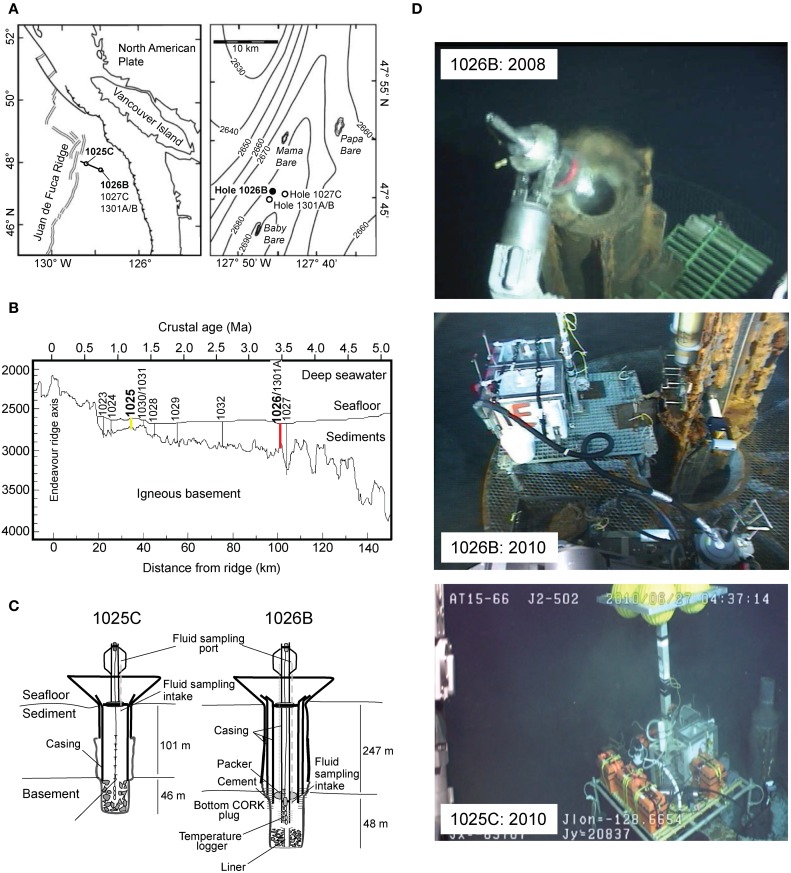
Figure 1.
(A) Location of CORK observatory sampling sites on the Juan de Fuca Ridge flank, Pacific Ocean. (B) Cross-sectional diagram of ODP Leg 168 showing depth of basement crust and sediment thickness, basement age and associated distance from ridge axis, and locations of Holes 1025 (yellow) and 1026 (red) in boldface font (modified from Wheat et al., 2004). (C) Schematic diagram of CORKs located at Holes 1025C and 1026B (not drawn to scale). Fluids were sampled from the exit valve of the fluid delivery line (modified from Lin et al., 2012). (D) Photo of squeeze sample taken for biogeochemical analysis from top of CORK 1026B in 2008, fluid sampling device used in 2010 at Hole 1026B, and Borehole Flushing Unit and fluid sampling device used at Hole 1025C in 2010.

