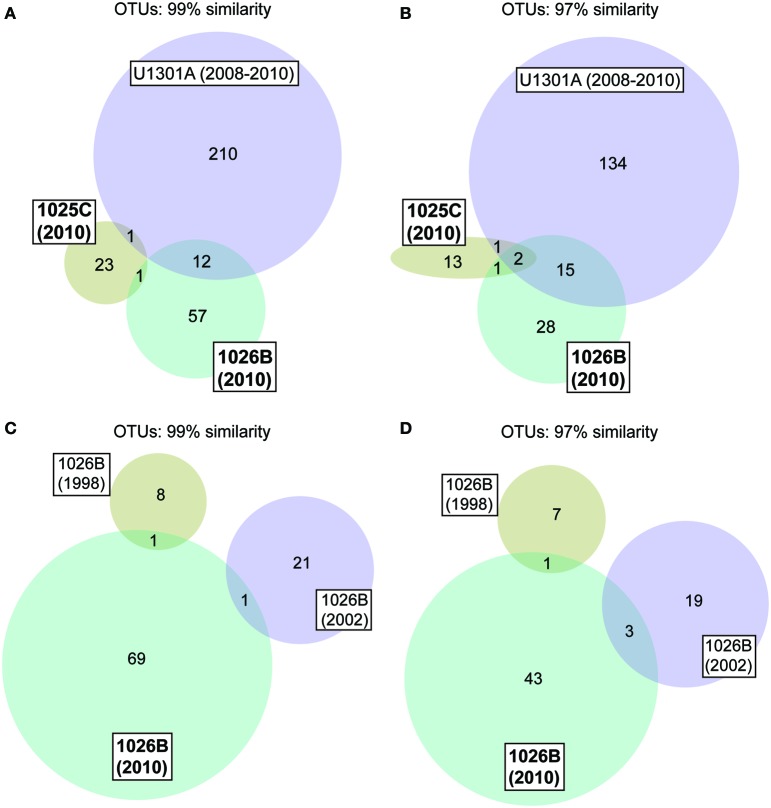
Figure 2.
Venn diagrams showing the overlap in microbial communities between Holes 1025C, 1026B, and U1301A fluids (A,B), and between Hole 1026B fluids collected in different years (C,D). Data for “U1301A 2008–2010” appears in Jungbluth et al. (2013), “1026B 1998” in Cowen et al. (2003), and “1026B 2002” in Huber et al. (2006).

