
Figure 1.
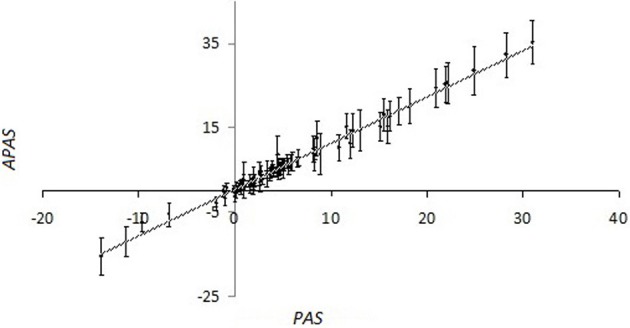
Values of pathway activation strength (APAS) that were calculated using the 98 random trials, each having random log-normally distributed weighting factors wn, vs. non-perturbed PAS for the different SPs, calculated using OncoFinder method. The pathway information was extracted from the SABiosciences database. Primary data are shown on the Supplementary dataset 3. For the perturbed values (APAS), both average values (points at the plot) and standard deviation bars are shown.