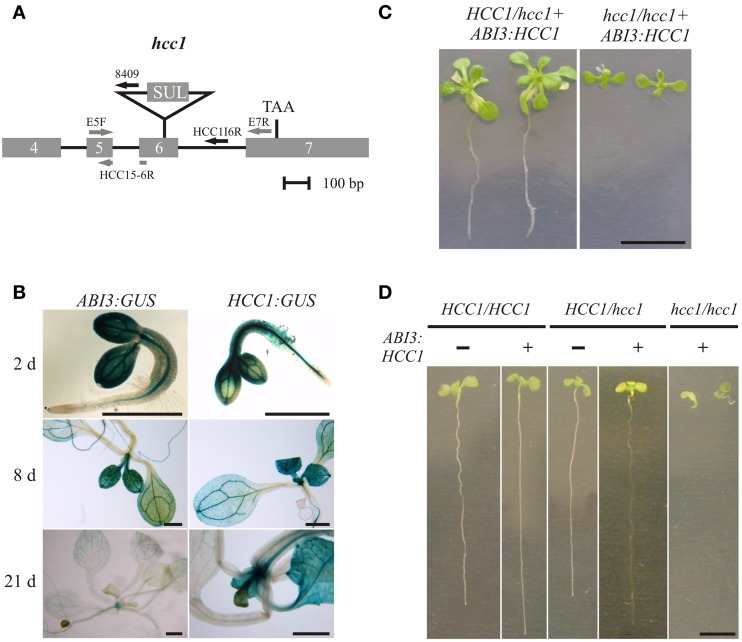
Figure 2.
Embryo-specific complementation of the hcc1 knockout. (A) A schematic diagram of the hcc1 allele is shown. The exons 4–7 and introns 4–6 of HCC1 are denoted by gray boxes and solid lines, respectively. The labeled arrows represent the primers used for genotyping. The gray and black arrow colors denote a binding site in a coding and noncoding region, respectively. Primer HCC1E5-6R spans the exon5-exon6 boundary. SUL, sulfadiazine resistance cassette; TAA, stop codon. (B) Seedlings selected on hyg from two ABI3:GUS lines (3 and 6) and the HCC1:GUS line 1 were stained for GUS activity at the indicated days after germination. The staining pattern was similar in both ABI3:GUS lines and representative images of line 3 are shown. The scale bars equal 1 mm each. (C) Progeny from a selfing cross of the hemizygous hcc1 mutant complemented with ABI3:HCC1 (line “Nils”) were grown on MS agar with hyg and sul for 21 days. The plants were photographed and then used for DNA isolation to determine their genotypes. The scale bar (=1 cm) is valid for both panels. (D) Progeny from a selfing cross of the hemizygous hcc1 mutant complemented with ABI3:HCC1 (line “Nils”) were grown on an MS agar plate without antibiotics for 13 days. Before each seedling was sacrificed for DNA isolation, the seedlings (sample size = 34) were laid out on agar plates, numbered consecutively and photographed. With the genotyping results at hand, representative images of the WT and the hemizygous HCC1/hcc1 mutant, both with or without the ABI3:HCC1 transgene, and of the ABI3:HCC1-complemented hcc1/hcc1 mutant were assembled for the overview. The scale bar equals 5 mm and is valid for all panels.

