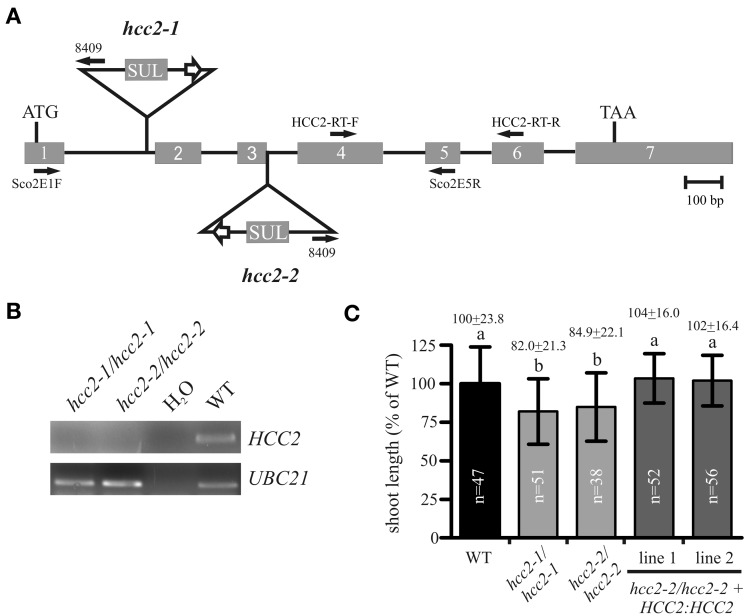
Figure 3.
Characterization of hcc2 T-DNA mutants. (A) The schematic diagram of the HCC2 gene shows the insertion sites of T-DNA for the hcc2-1 and hcc2-2 mutant, respectively, the orientation and location of primers (solid arrows), the start (ATG) and stop (TAA) codon. Exons (gray boxes) and introns (solid lines) are drawn to scale. The white arrows denote 35S promoters. SUL, sulfadiazine resistance cassette. (B) RT-PCR analysis of HCC2 expression in homozygous hcc2 mutants and the WT. Water instead of cDNA was used as a negative control. The amplification of a UBC21 DNA fragment served as evidence for the presence of cDNA in a reaction. (C) The primary stems of 38-day-old plants were measured. The average length (=24 cm) of WT stems was normalized to 100%. Values represent means ± standard deviations (SD). Columns with different letters are significantly different from each other (p < 0.01; one-way analysis of variance; Tukey test). The diagram combines the data from two independent experiments. The sample sizes (n) are indicated.

