
Figure 5.
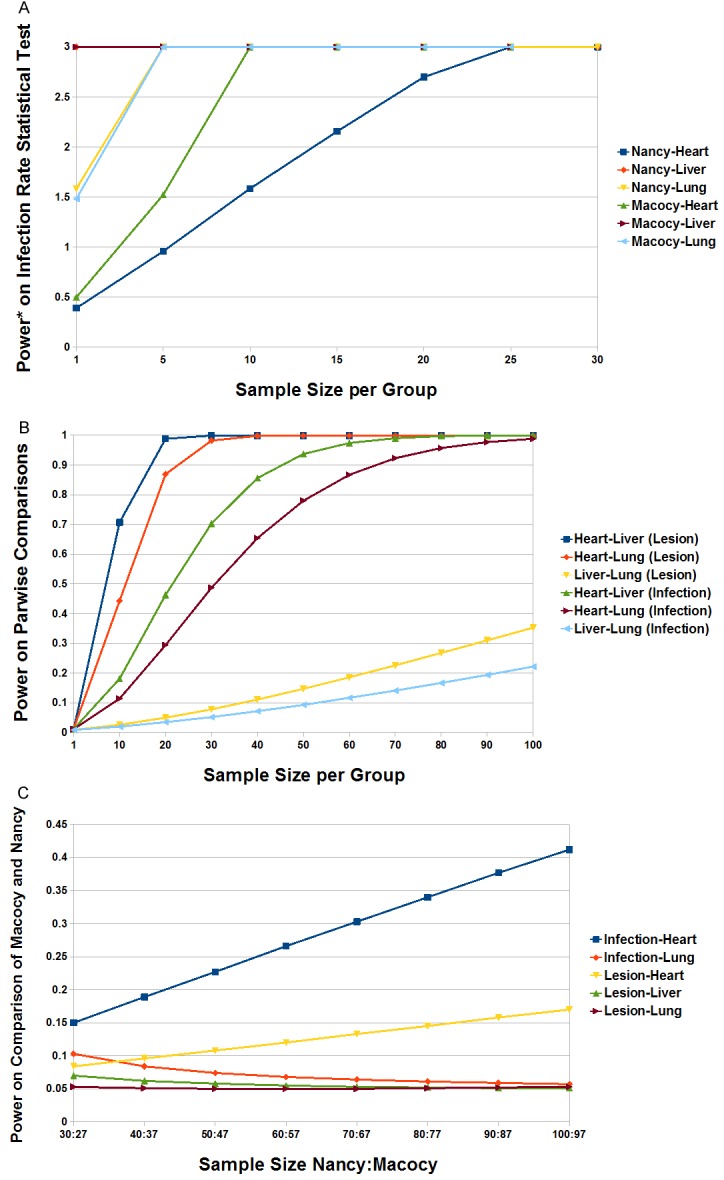
The sample size in statistical tests. A. The trend of sample size for the infection of heart, liver and lung of group Macocy and Nancy was shown by the six color lines, with the arising of the power value. The power* represents the mathematically changed power by log101/(1-x), in which x = power and power* = log101/(1-x). For instance, power* of 0.39 equals power of 0.59, power* of 1.52 equals power of 0.97 and so on. B. The trend of sample size for comparing the lesions of heart-liver, heart-lung, and liver-lung, as well as the infection of heart-liver, heart-lung, and liver-lung was shown by the six color lines, with the power value arising. C. The trend of sample size for comparing the infection and lesions respectively for group Macocy versus Nancy on heart, lung and liver was shown by the five color lines, with the power value arising.