
Figure 1.
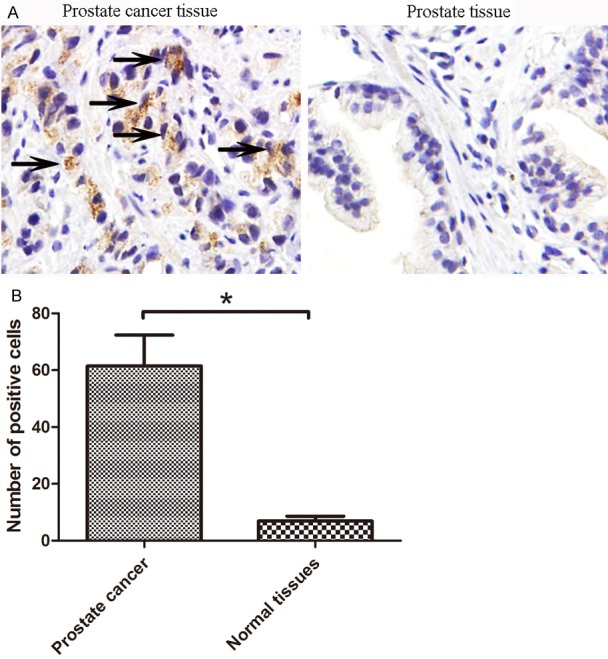
mTOR is over-expressed in human prostate cancer tissues compared to normal tissue samples. A: Immunohistochemical staining of mTOR. A tissue was stained for mTOR; B: Quantitation of mTOR immunostaining. Numbers of positive cells were counted for mTOR staining. Tissue types were grouped. The groups were compared using a 2-tailed Fisher’s exact test with a p-value of 0.05 and was therefore considered statistically significant (*). Black arrowhead stands for the positive mTOR staining.