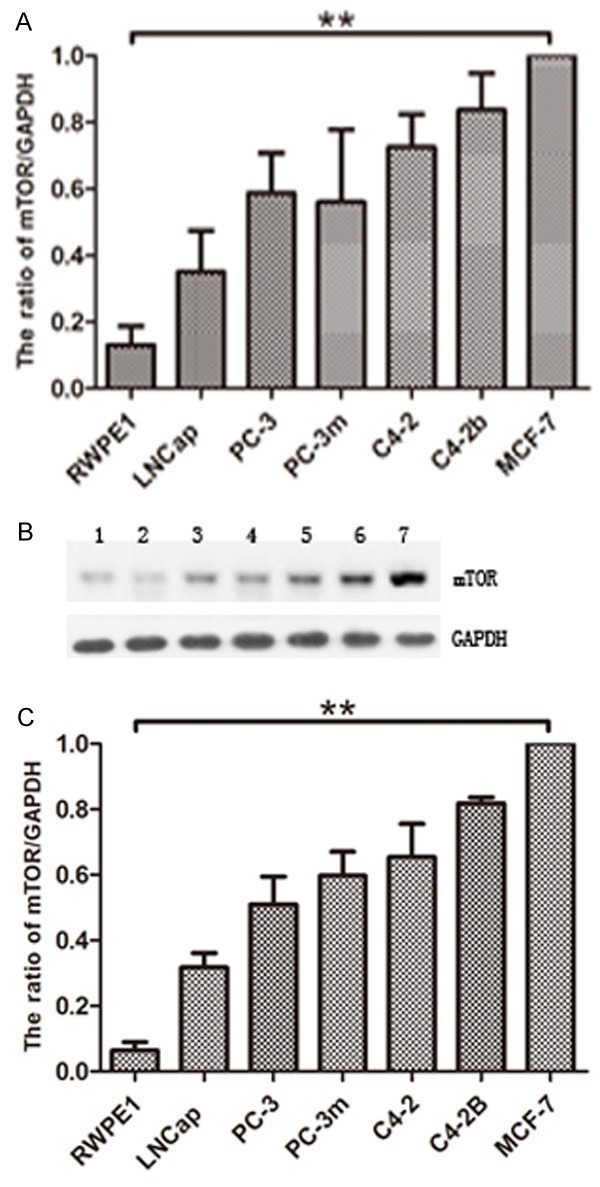
Figure 2.

mTOR is over-expressed in prostate cancer cells compared to normal prostate cells. mTOR mRNA and protein levels in prostate cancer cells versus RWPE1. Quantitative real time RT-PCR (A) and Western blot analysis (B & C) of endogenous mTOR expression was performed using normal RWPE1 and five prostate cancer cell lines LNCap, PC-3, PC-3m, C4-2 and C4-2B. MCF-7 is loaded as positive control. For RT-PCR, mTOR mRNA levels were quantitated relative to GAPDH mRNA and calculated using the ΔΔCt method. (B) Western blot analysis of the mTOR and GAPDH. 1: RWPE1; 2: LNCap; 3: PC-3; 4: PC-3m; 5: C4-2; 6: C4-2B; 7: MCF-7. (C) The protein levels were quantitated by a densitometric analysis of protein bands. The data (relative density normalized to GAPDH) is expressed as mean ± standard deviation of three experiments (**p<0.01) .
