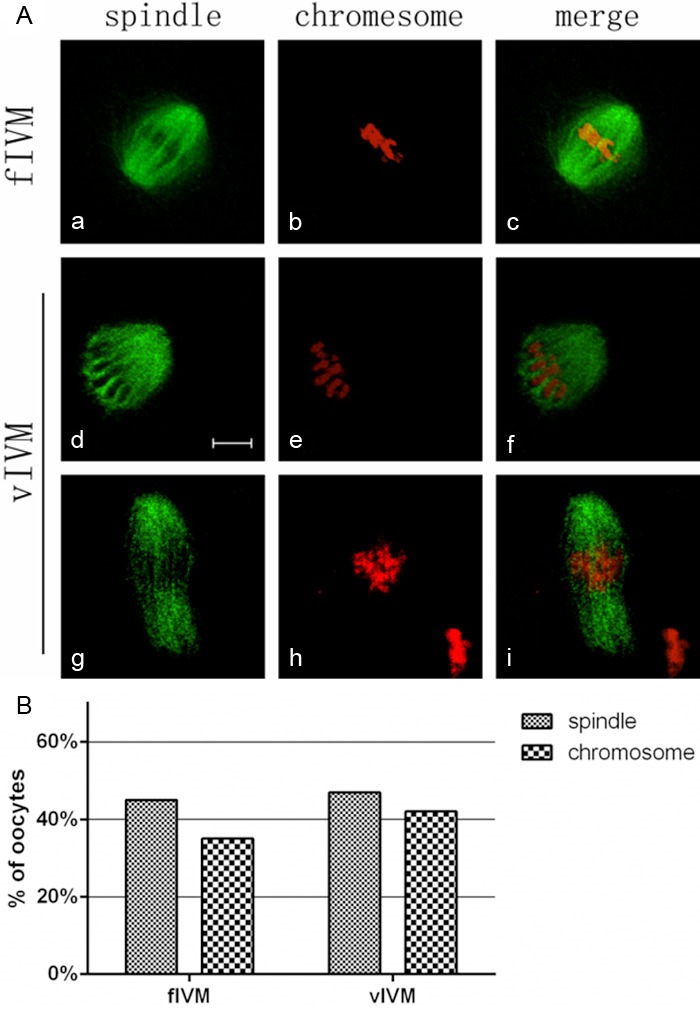
Figure 2.

The change of spindles and chromosomes after vitrification. (A) Representative images of the spindles and chromosomes in both groups. Normal spindle and aligned chromosomes are seen in fIVM; misaligned chromosomes were detected in model groups. Figures (d) and (g) show the defective spindles; Figures (e) and (h) show lagging chromosomes and irregularly scattered chromosomes; Figures (c), (f) and (i) include chromosomes and spindles. α-Tubulin (green); DNA (red). (Bar=10 um); (B) Percentage of oocytes with abnormal spindle and misaligned chromosomes in MII oocytes, data are mean + SEM of at least three independent experiments.
