
Figure 1.
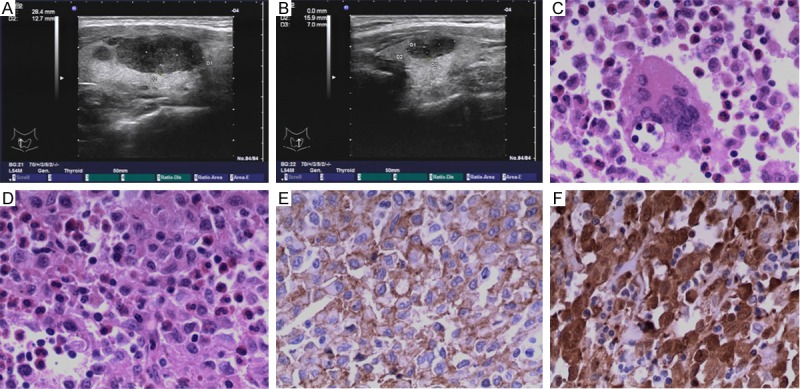
A: High-resolutions ultrasound image of the right thyroid lobe shows hypoechoic nodule. B: High-resolutions ultrasound image of the left thyroid lobe shows hypoechoic nodule. C: Cytologic smear from case 1 showing Langerhans cell with centrally or eccentrically located, oval to reniform “coffee bean” nuclei mixed with many mature eosinophils (×200). D: Hematoxylin and Eosin staining (×200) revealed Langerhans cells proliferated, with eosinophils infiltrated. E: Immunohistochemical staining showing strong reactivity of Langerhans cells for CD1α (×200). F: Immunohistochemical staining showing strong reactivity of Langerhans cells for S100 (×200).