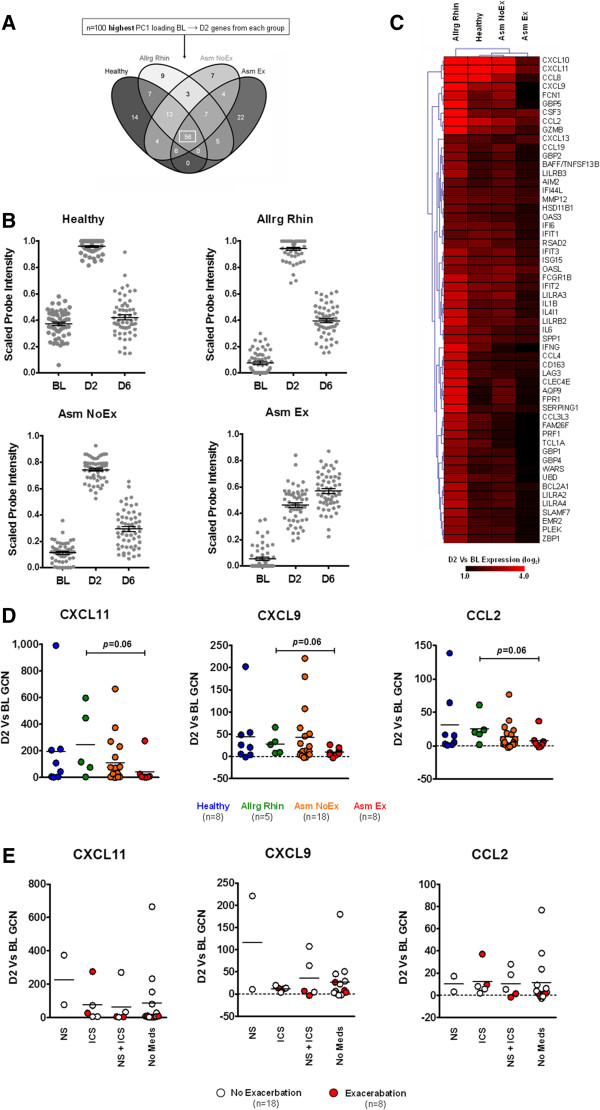
Figure 2.
Peak stage of acute respiratory illness. (A) Comparative analysis of the acute respiratory illness-associated genes from each group revealed that D2 was defined by a core transcriptional profile regardless of disease status (box). Complete gene lists for each comparison are outlined in Table S1 in Additional file 2. (B) Kinetics of core-D2 gene expression in each study group (n = 56 probes/time point). (C) Hierarchical clustering analysis of the D2 versus baseline microarray expression of the core-D2 genes. (D) Quantitative real-time PCR confirmation of select core-D2 gene expression. Horizontal line depicts mean. Number of matched BL and D2 samples from each group used for quantitative real-time PCR assays are indicated below. (E) Influence of medication use on core-D2 gene expression for all asthmatics. Horizontal line depicts mean. BL, baseline; CXCL11/9, Chemokine (C-X-C motif) ligands; CCL2, Chemokine (C-C motif) ligand; D2, day 2; D6, day 6; GCN, fold change in normalized gene copy number; ICS, inhaled corticosteroids; NS, nasal steroids.

