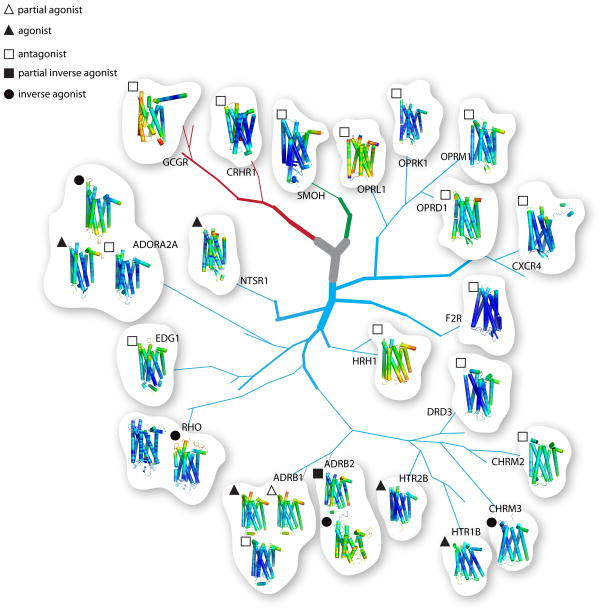
Fig. 1. Phylogenetic tree of GPCRs with known X-ray structures.
Branches and sub-branches (detailed methods are described elsewhere) of the GPCR phylogenetic tree are shown (adapted from Katritch et al. [25]). Branches of varying thickness represent different subgroups. Known structures from class A (rhodopsin subfamily, light blue branches), class B (secretin subfamily, red branches), and class F (frizzled, green branches) GPCRs are shown, but other groups such as the adhesion and glutamate GPCRs are not included. Structures of known GPCRs obtained in the presence of different ligands are clustered together. Types of ligands are identified by geometrical shapes placed at the top left corner of each individual GPCR structure. Structures with partial agonists are denoted with open triangles, agonists are highlighted with closed triangles, antagonists are identified by open squares, partial inverse agonists are marked by closed squares and inverse agonists are shown with closed circles. GPCRs bound to different inhibitors are identified by their gene names. B-factors for each individual GPCR structure were used to generate the GPCR rainbow color coding (blue through red, for minimum and maximum B-factor values, respectively). The gene names of the clustered structures and their corresponding PDB codes are: RHO (1U19 and 3CAP); ADRB1 (2VT4, 2Y02, and 2Y01); ADRB2 (2R4R and 2RH1); HTR2B (4IB4); HTR1B (4IAQ); CHRM3 (4DAJ); CHRM2 (3UON); DRD3 (3PBL); HRH1 (3RZE); F2R (3VW7); CXCR4 (3ODU); OPRD1 (4EJ4); OPRM1 (4DKL); OPRK1 (4DJH); OPRL1 (4EA3); NTSR1 (4GRV); ADORA2A (3QAK; 3VGA), and 3EML); EDG1 (3V2W); CRF1R (4K5Y); GCGR (4L6R); SMOH (4JKV).

