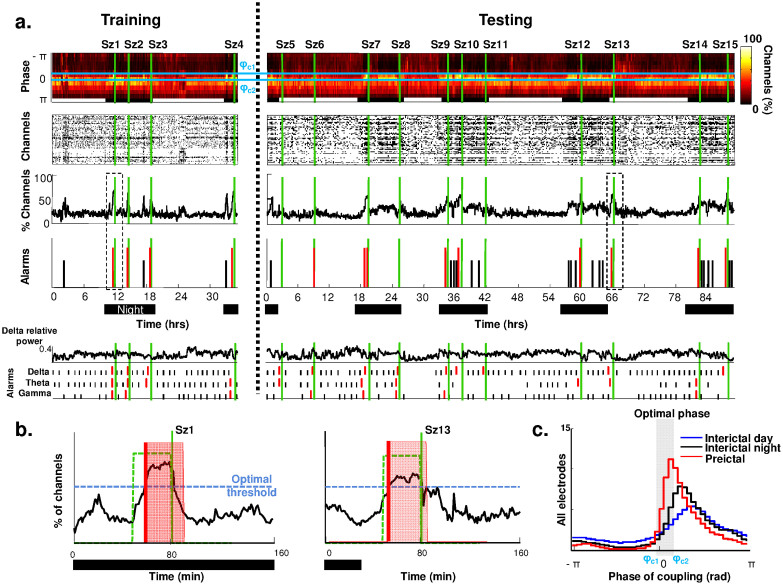
Figure 2. Prospective preictal state detection from dynamics of the mean coupling phase.
(a). From top to bottom: Proportion of electrodes with a specific coupling phase over time (11 phase intervals; vertical green lines indicate seizure onsets); raster plot of contacts with a coupling phase in the interval [ϕc1, ϕc2] (horizontal blue lines); total proportion of channels over time; alarm triggered when the proportion of channels crosses a selected threshold. Several parameters of the algorithm were optimized from data of the training period, before the optimal selection was tested on new data from the testing period; Triggered alarms of the same prediction strategy but applied to the power in individual bands delta, theta and gamma. (b). Triggered alarms for two different seizures (green lines), followed by a refractory time equal to the assumed preictal duration. Vertical red lines show raised alarms and green dashed lines indicate the preictal interval. (c). Histogram of phase of coupling during preictal, interictal/day and interictal/night periods reflect the changes of coupling phase prior to seizures.

