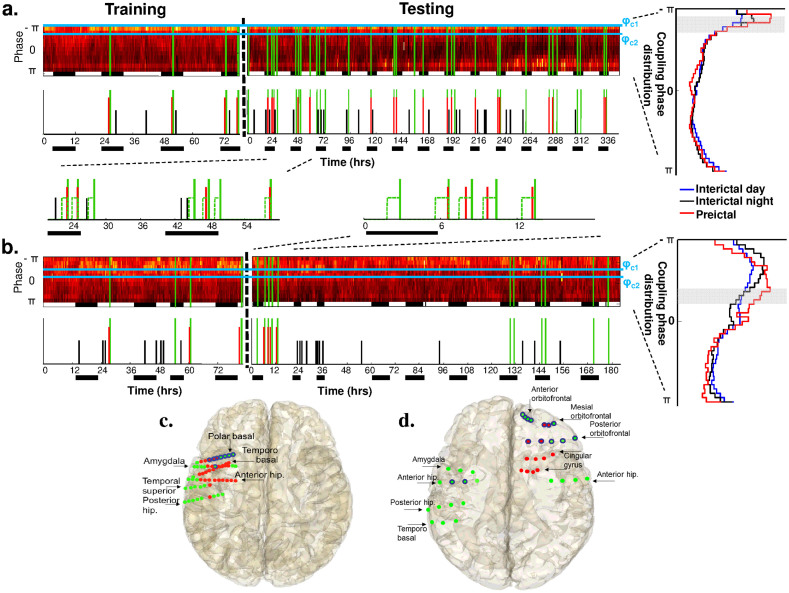
Figure 3. Data from two representative patients with statistically significant results.
(a–b). Proportion of electrodes with a specific coupling phase over time (top) and alarms triggered when the proportion of channels crosses a selected threshold (bottom). Green lines depict seizures. Alarms linked to correct predictions shown in red and false positives in black reveal a high sensitivity and specificity. In (a) (left), the histogram of the coupling phase for 3 different periods (preictal, interictal/day and interictal/night) showed no significant phase variation but a preictal increase in the number of implicated contacts. In (b) (left), the histogram of phase of coupling shifts clearly during the preictal period. (c–d) Spatial representation of contacts for the two patients shown in A and B. Projected over the MRI reconstruction, contacts in the epileptic focus are indicated in blue. Contacts where the phase changed significantly to the optimal phase during preictal periods are indicated in red. Contacts outside the focus which did not change during the transition are depicted in green. Note that, despite a widespread spatial distribution, the contacts remained close to the focal regions.

