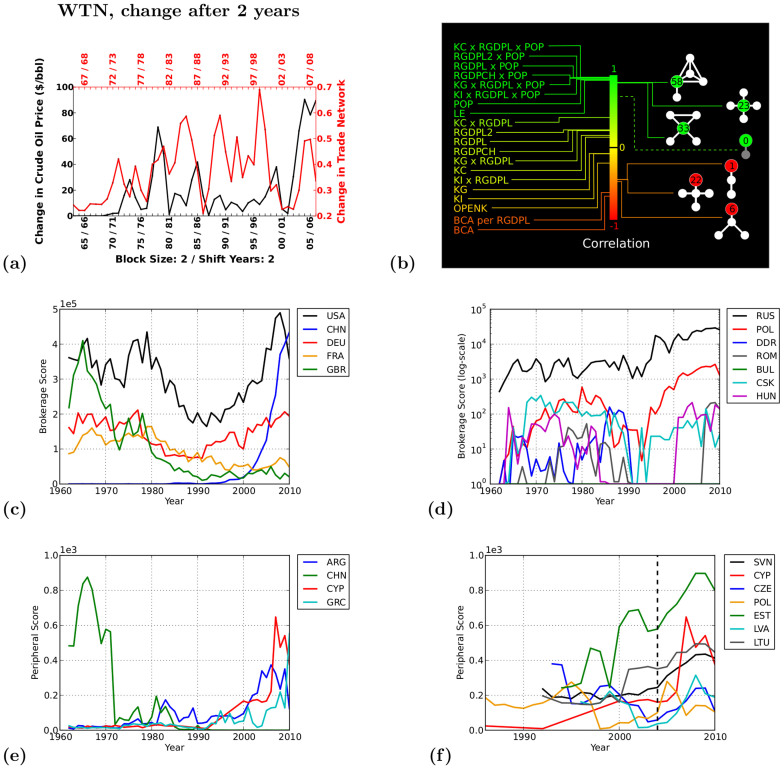
Figure 4. Results of world trade network analysis.
(a) Correlation of changes in crude oil price and changes in the structure of WTN, with the block size of two years and a two year shift; the Spearman correlation coefficient is 0.414 with the p-value of 0.005. (b) CCA correlations between economic attributes on the left (described in Supplementary Information) and graphlet degrees on the right; the middle bar is color-coded value of correlation. (c) Brokerage scores of the United States (USA), China (CHN), Germany (DEU), France (FRA), and the United Kingdom (GBR) from 1962 to 2010. (d) Brokerage scores of the Eastern Bloc from 1962 to 2010: the Soviet Union until 1991 replaced by Russia afterwards (RUS), Poland (POL), Eastern Germany (DDR), Romania (ROM), Bulgaria (BUL), Czechoslovakia until 1991 replaced by the sum of Czech Republic and Slovakia afterwards (CSK), and Hungary (HUN). (e) Peripheral scores of Argentina (ARG), China (CHN), Cyprus (CYP), and Greece (GRC) from 1962 to 2010. (f) Peripheral scores of countries that joined EU in 2004 and show an increase in their peripheral scores right before and after joining the EU: Slovenia (SVN), Cyprus (CYP), Czech Republic (CZE), Poland (POL), Estonia (EST), Latvia (LVA), and Lithuania (LTU).

