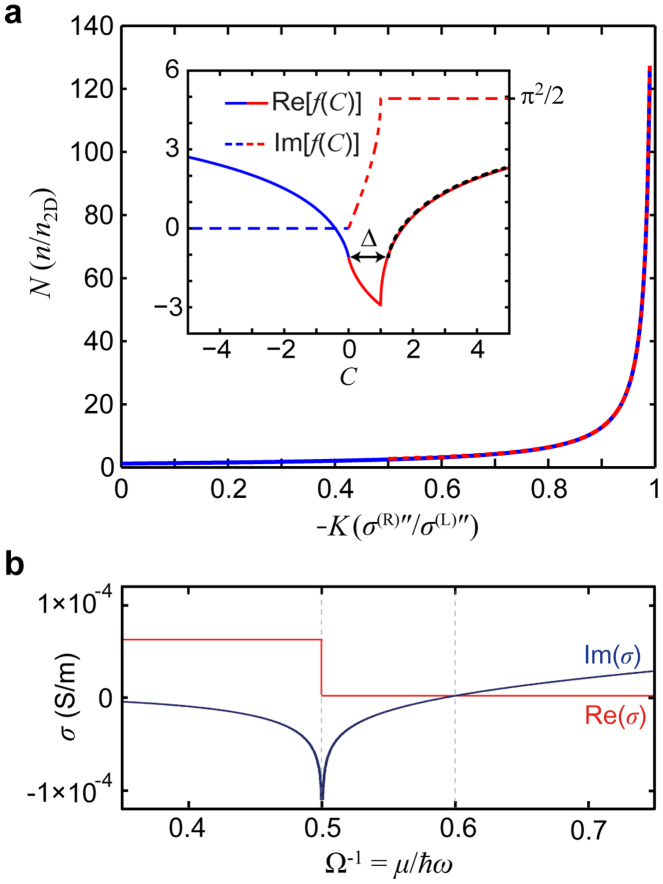
Figure 4. 1DSPP dispersion and graphene conductivity.
(a), The numerical solution [solid blue curve; equation (1)] and the asymptotic expression [dashed red curve; equation (2) for |K| > 0.5] are both shown. Inset: Real (solid curve) and imaginary (dashed curve) parts of the function f(C). The colour distinguishes C > 0 (red) from C < 0 (blue). The black overlaid dotted curve corresponds to Re[f(C + Δ)] ≈ Re[f(−C)]. (b), Conductivity of graphene in the local and zero-temperature limit.

