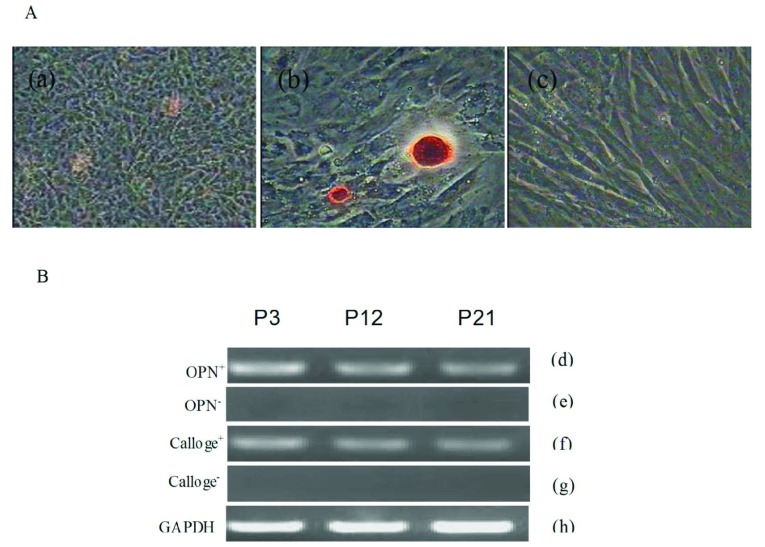
Figure 4. Osteogenic differentiation of DMSCs.
(A) (a) Following induction cell morphology had larger and more apparent nodules as induction time increased. (b) Alizarin Red staining at day 14 post-induction. (c) Control group. (B) RT–PCR assays shown expression of osteoblast-marker genes, including collagen type I, osteopontin, at day 14 post-induction. (d, f) Express osteogenic differentiation marker genes collagen type I, osteopontin. (e, g) Negative control displayed the osteogenic differentiation marker genes were negative. (h) GAPDH as internal control

