
Figure 2.
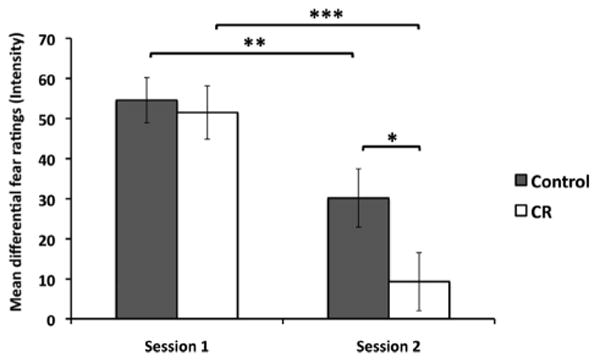
The average differential fear ratings for each group across sessions (CS+ minus CS−). The two groups showed roughly equivalent fear responses in Session 1. Both the control and cognitive restructuring (CR) groups demonstrated a significant reduction in differential fear ratings across sessions. During Session 2, the CR group had significantly lower differential fear ratings compared with the control group. * p < .05; ** p < .01; *** p < .001. Error bars indicate standard error of the mean.