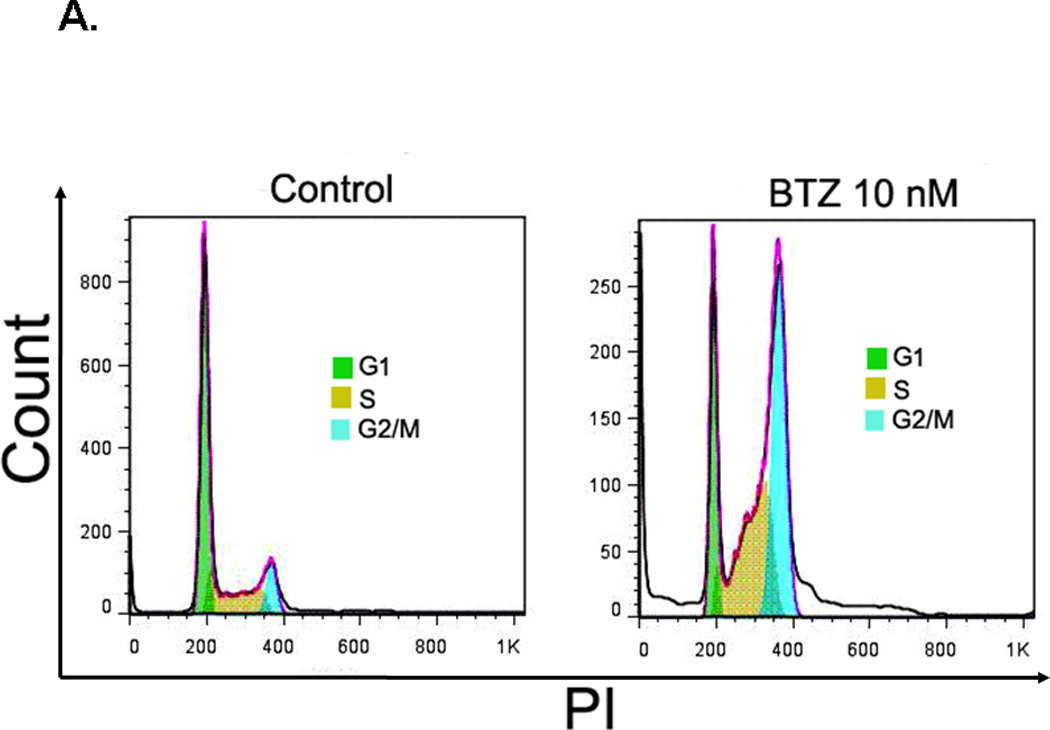
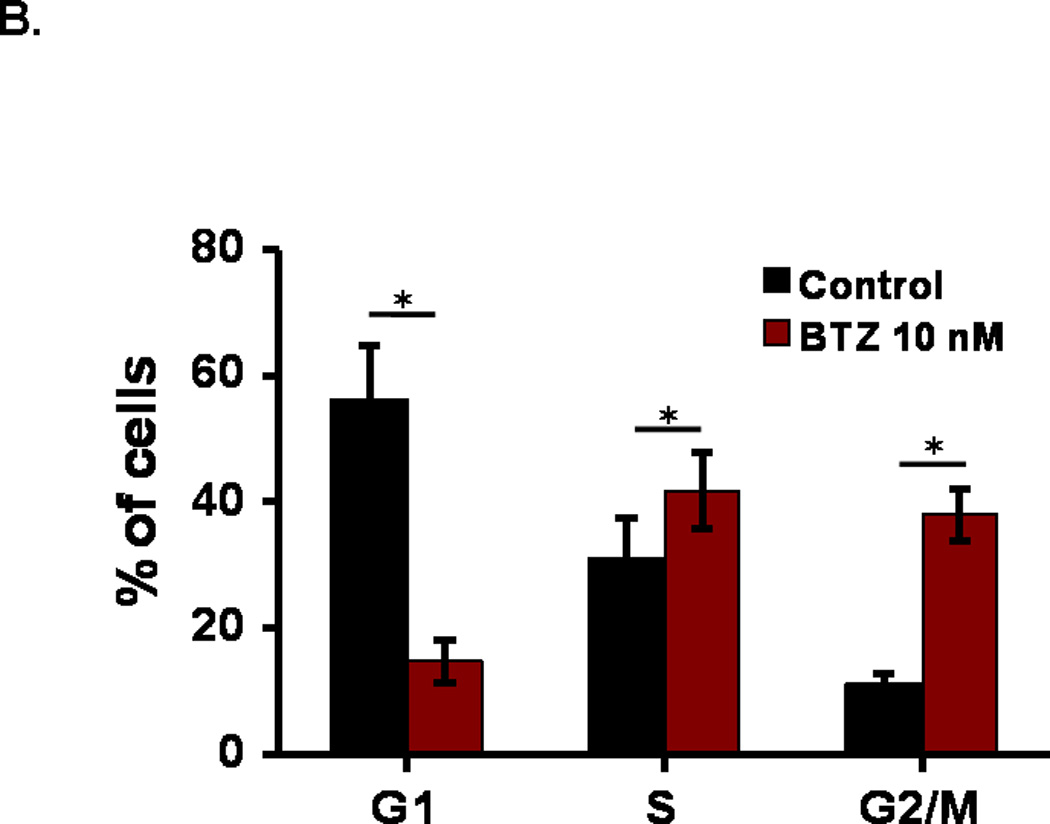
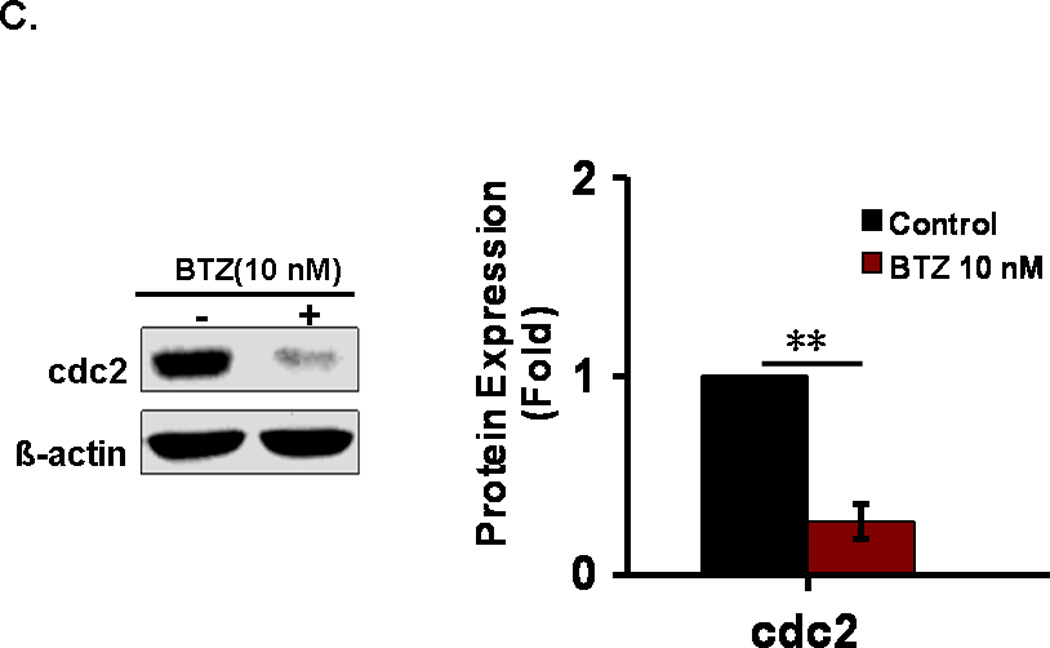
Fig. 2.


Cell cycle analysis. (A). C2C12 cells were stained with PI and then analyzed by flow cytometry as described in the materials and methods. C2C12 cells were exposed to 10 nM BTZ for 24 h. (B). Bar graph showing the percentage of cell cycle at G1, S, and G2/M phases. (C). The protein levels of cdc2 in C2C12 cells treated by BTZ (10 nM, 24h) were examined by immunoblotting. The bands were quantified by ImageJ and the expression levels of cdc2 were normalized to beta-actin. *P<0.05, **P<0.01.
