Fig. 3.


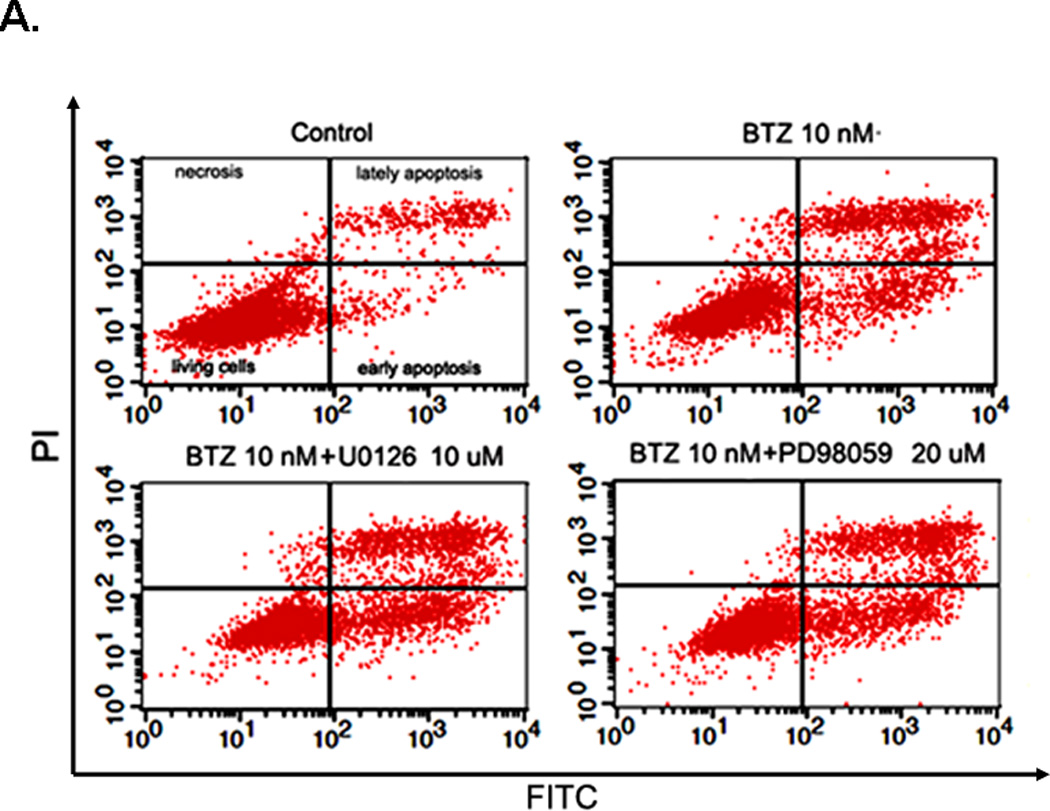
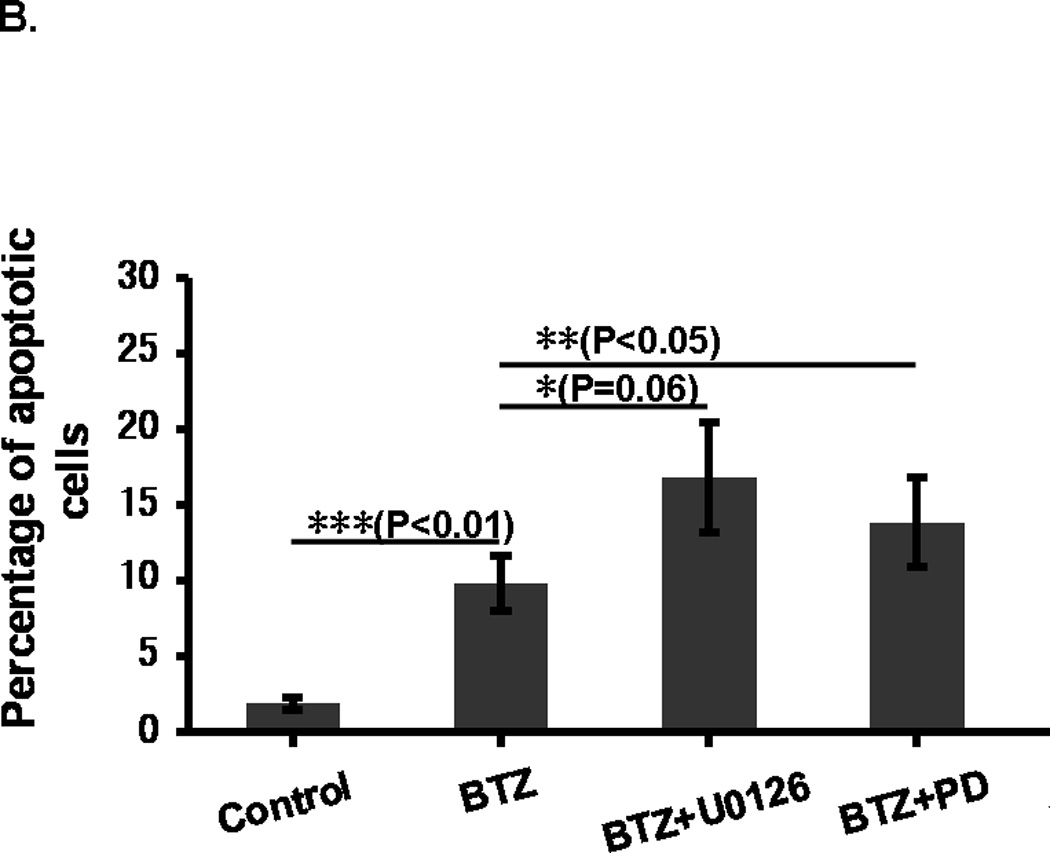
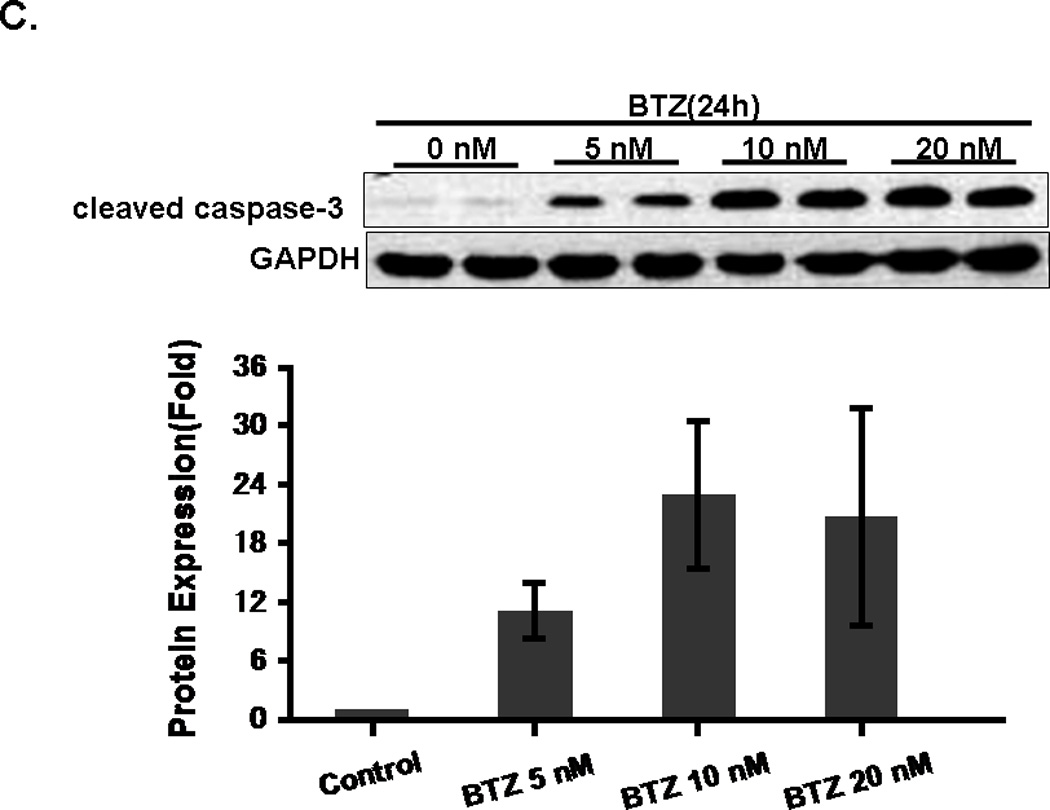
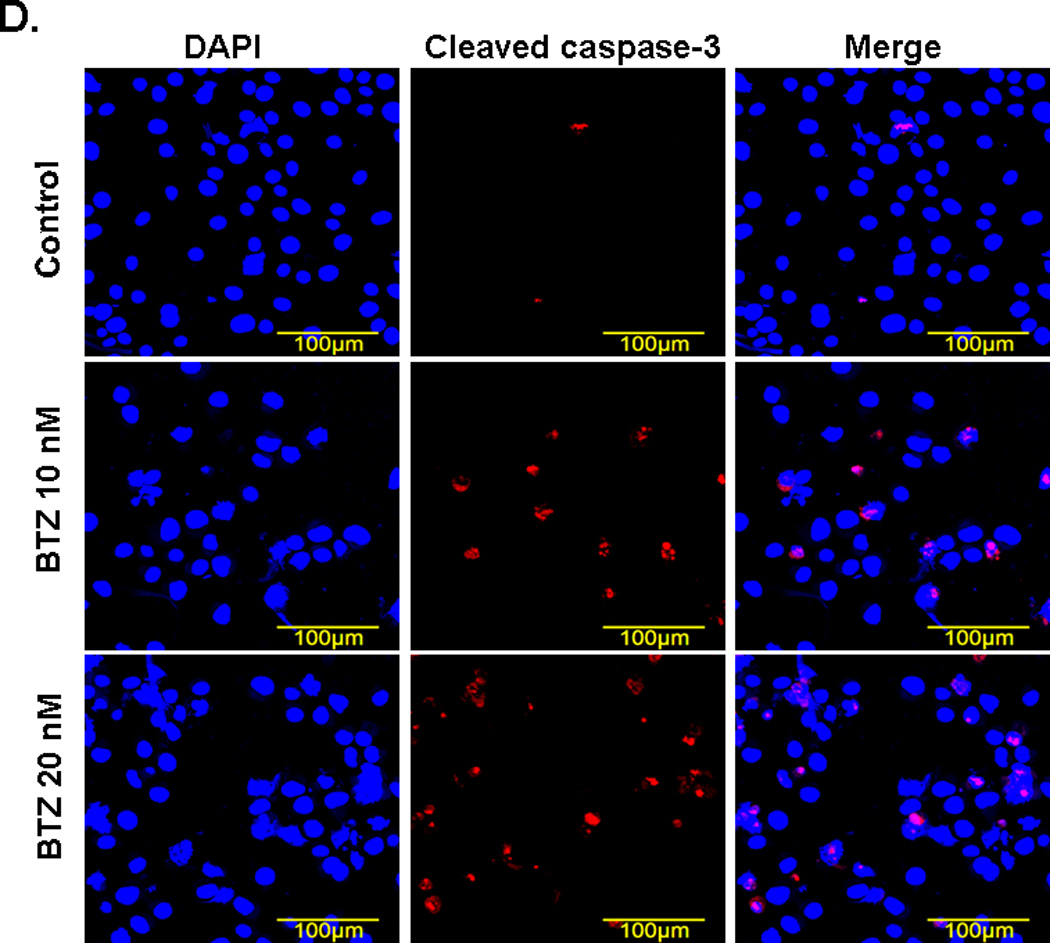
BTZ induces apoptosis in C2C12 cells. (A). Flow cytometry chart of C2C12 cells stained with Annexin V and propidium iodide (PI). C2C12 cells were either treated with BTZ alone or in combination with MAPK pathway inhibitors U1026 or PD98059 (PD) for 24 h. (B). Bar graph showing the percentage of cells undergoing apoptosis. (C). The level of cleaved caspase-3 was assessed by immunoblotting. The bands were quantified by ImageJ and normalized to GAPDH. The graph represents the quantification from 3 independent blots. (D). Immunofluorescence staining of cleaved caspase-3 in C2C12 cells after exposing to BTZ for 24 h.
