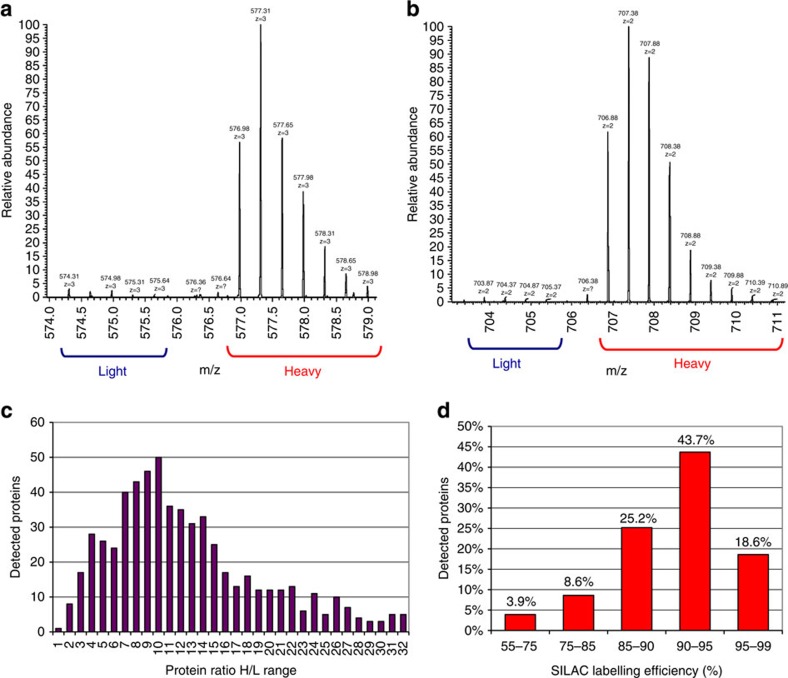
Figure 1. SILAC labelling efficiency in D. discoideum.
(a) Mass spectrum (MS) of a peptide containing a single lysine residue (ALHLFGPTLGYFGEAK) with heavy/light (H/L) ratio value of 29.7. (b) MS of a peptide containing a single arginine residue (AAITNDFIGSEIR) with H/L ratio value of 51.9. Blue brackets indicate isotopic distribution peaks belonging to the ‘light’ forms and red brackets to the ‘heavy’ forms. (c) Protein H/L ratios distribution of 616 detected proteins. H/L ratio 4 indicates a 80% labelling efficiency, H/L ratio 9 indicates 90% labelling efficiency and H/L ratio 19 indicates 95% labelling efficiency etc. (d) Labelling efficiency distribution of all the detected proteins. The analysed sample came from a cell population grown in a defined medium containing K8 L-lysine and R6 L-arginine for five rounds of cell doubling.

