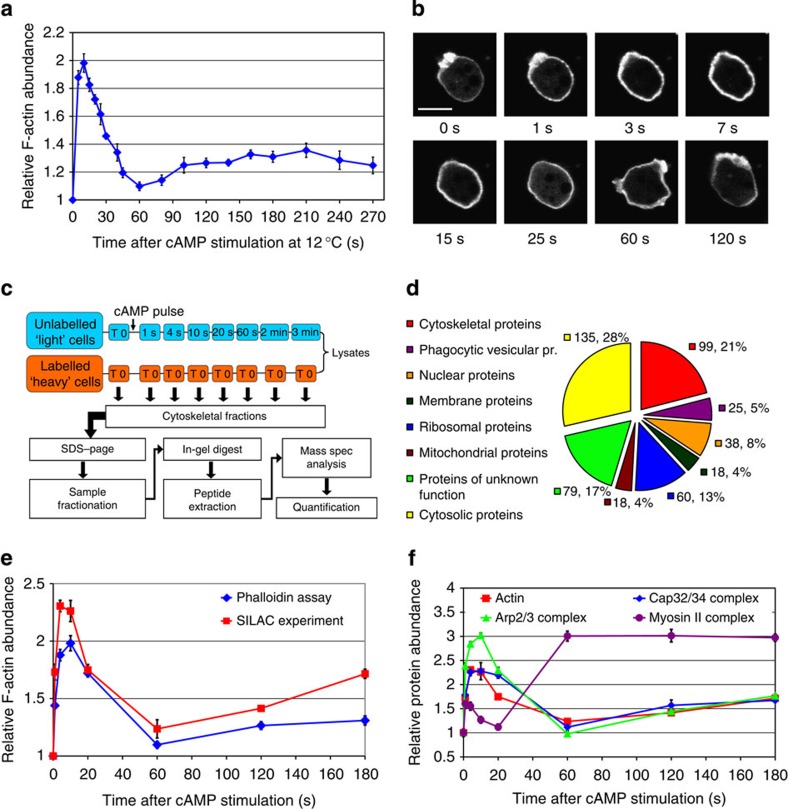
Figure 2. Cytoskeletal dynamics during chemotactic response and SILAC experimental approach.
(a) Graph of actin polymerization dynamics after cAMP stimulation measured at 12 °C using the phalloidin assay. Graph represents a mean of 15 measurements and error bars represent standard error of the mean (s.e.m.). (b) Confocal images of a cell expressing LifeAct-RFP at different time points after cAMP stimulation. The 1-s, 3-s, 7-s time points correspond to the 1st phase of actin polymerization, 15 and 25 s to the actin depolymerization phase, 60 and 120 s to the 2nd polymerization phase. Scale bar, 10 μm. (c) Workflow chart of the SILAC experiment. Unlabelled cells are stimulated with cAMP at 12 °C and lysed at various time points after stimulation. Lysates are mixed in equal proportions with SILAC cell lysates from unstimulated cells. Crude cytoskeletal fractions are processed by separation on SDS–PAGE and gels fractionation followed by in-gel tryptic digest. Peptides are analysed using tandem mass spectrometry. The mass spec data are processed and quantified by Mascot and MaxQuant. (d) Distribution of Gene Ontology (GO) term annotations in the filtered data set of detected proteins showing reproducible temporal enrichment profiles. Values indicate number of proteins in each GO component annotation group and percentage of the total number of proteins in the filtered data set. (e) Comparison of the actin polymerization dynamics profiles measured in the phalloidin assay (blue) and the SILAC experiments (red). Blue graph represents the mean of 15 measurements and red graph represents mean of two biological replicates of the SILAC experiment, error bars represent s.e.m. (f) Protein incorporation dynamics of the major structural components of the cytoskeleton. Graphs show temporal enrichment profiles for actin (red—same as in e), Arp2/3 (green), Cap32/34 (blue) and myosin II (purple) protein complexes. All the graphs except for actin, represent means of the enrichment values for all the subunits of each protein complex from two biological replicates of the SILAC experiment, error bars represent s.e.m.

