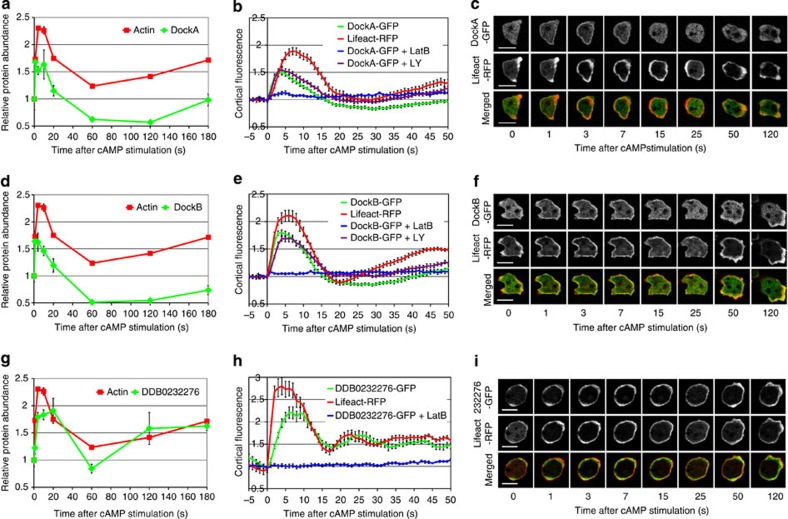
Figure 4. Comparison of SILAC-based protein dynamics with the in vivo dynamics of GFP-tagged proteins.
Results for three proteins of interest: DockA (a–c); DockB (d–f) and a novel protein DDB0232276 (g–i). (a,d,g) Protein translocation dynamics measured in the SILAC experiments. Incorporation profiles of the analysed proteins (green) compared with F-actin dynamics (red). Graphs represent means from two biological replicates and error bars represent s.e.m. (b,e,h) Protein translocation measured by confocal imaging of cells co-expressing GFP-tagged proteins together with Lifeact-RFP. Graphs represent quantification of cortical fluorescence intensity relative to the cytosolic fluorescence intensity and normalized to the pre-stimulation time point. Both GFP signal (green) and RFP signal (red) were measured simultaneously during response to cAMP stimulation. Blue lines indicate GFP signal quantification from cells stimulated with cAMP at the presence of 15 μM Latrunculin B. Purple lines indicate GFP signal quantification from cells stimulated in the presence of 80 μM LY294002. Data shown are means and standard errors (s.e.) for a minimum of 10 cells measured in at least two different experimental days. (c,f,i) Micrographs of confocal imaging of stimulated cells from selected time points representing peaks of different phases of actin polymerization dynamics. GFP channel is shown in the top row, RFP channel in the middle and merged channel in the bottom row of each panel. Scale bars, 10 μm. See also Supplementary Movies 1, 2 and 3.

