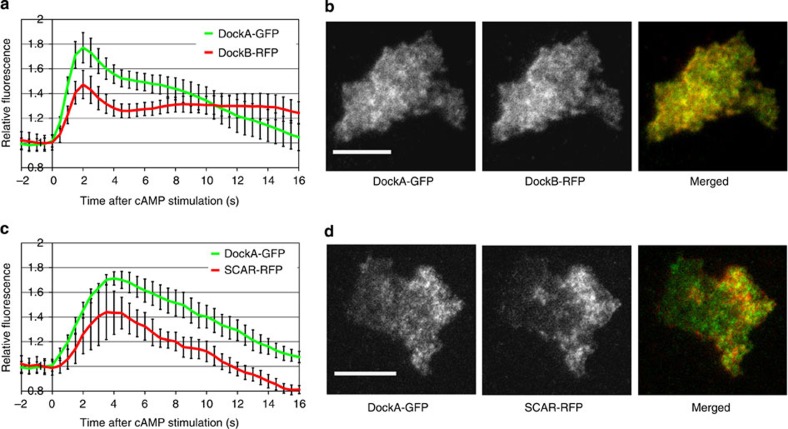
Figure 6. Co-localization analysis from dual-channel TIRF microscopy.
DockA-GFP was co-expressed with DockB-RFP (a,b) and SCAR-RFP (c,d). Both GFP and RFP signals were simultaneously imaged using TIRF microscope with an image splitter at two frames per second (fps). (a,c) Quantification of cAMP-induced translocation dynamics. Graphs represent average fluorescence intensity from the cell area normalized to the pre-stimulation time point. Data shown are means and s.e. for a minimum of 10 cells measured in at least two different experimental days. (b,d) Micrographs from the TIRF imaging showing cells at the peak of the 1st phase of actin polymerization. GFP channel is shown on the left, RFP channel in the middle and merged channel on the right. Scale bars, 10 μm. See also Fig. 7 and Supplementary Movies 4, 5.

