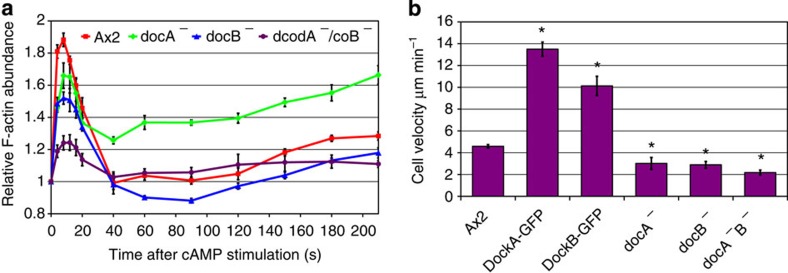
Figure 8. Phenotypes of deletion and overexpression of Dock proteins.
(a) cAMP-dependent actin polymerization response measured in wild-type (Ax2) cells (red), docA KO cells (green), docB KO cells (blue) and docA/docB double KO cells (purple). Graph shows quantification of actin bands in the cytoskeletal fractions separated by SDS–PAGE and stained with fluorescent protein dye—Krypton. Plots represent means and s.e. of four separate experiments normalized to the pre-stimulation time point. (b) Velocity data of wild-type strain (Ax2), strains overexpressing Dock proteins and knockout mutants. Vegetative cells expressing LifeAct-RFP were imaged with confocal microscope during random walk for 20 min; their velocity was quantified using Quimp software. Bars represent average velocities and s.e. from at least 15 cells. The overexpressors showed statistically significant (t-test) increased velocity (Ax2/DockA (P=5.4e−14), Ax2/DockB, (P=3.6e−7)) and the knockouts were significantly slower (Ax2/docA− (P=1e−2), Ax2/docB− (P=1e−4), Ax2/docA−docB− (P=4.9e−7)) compared with wild-type Ax2 cells.

