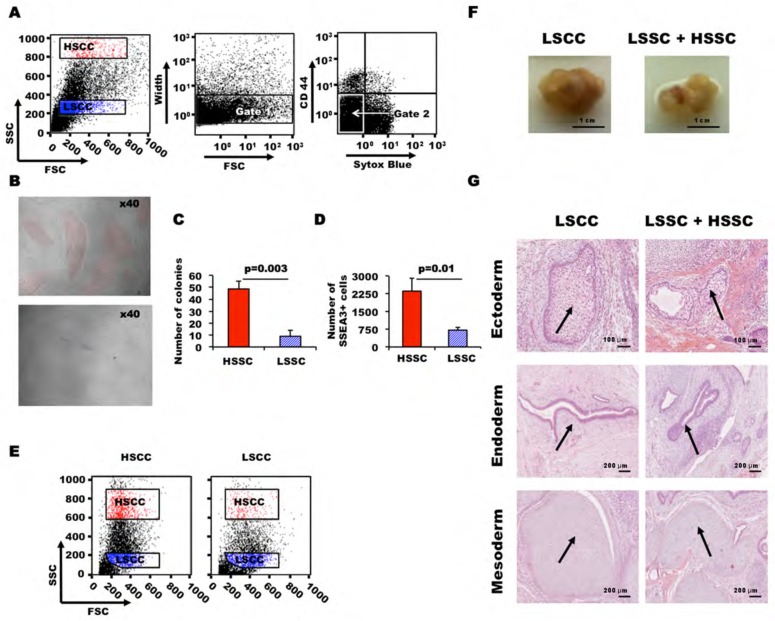
Figure 4. Clonogenic self-renewal efficiency of HSSC and LSSC PSCs.
(A–E) FACS-sorted HSSC and LSSC cells were plated in 96-well plates (500 cells/well) and cultured for 5 days. (A) During cell sorting, debris, aggregates, dead cells and feeder cells were excluded using the FSC-SSC and FSC-Width parameters and labelling with the anti-CD44 antibody and Sytox Blue stain, respectively. (B) Representative phase contrast images of PSC colonies from HSSC (upper panel) and LSSC cells (lower panel) at day 5 after sorting, highlighted in red and blue respectively. (C and D) Bar plots display the number of colonies and of SSEA3-positive cells per well from FACS-sorted HSCC and LSSC cells measured by quantitative flow cytometry using Flow Check beads. (E) FSC and SSC analysis of HSCC and LSSC cells after 5 days of culture show that each population regenerates both cell types. (F, G) Teratomas obtained by subcutaneous injection of LSSC and LSSC + HSSC cells in NOD/SCID/IL2RG−/− mice: tumors (F) and Hematoxylin-Eosin-Safran staining of tumor sections (G) arrows showing glycogenated squamous epithelium (ectoderm), epithelium with caliciform cells (endoderm) and cartilage (mesoderm).

