
Figure 4.
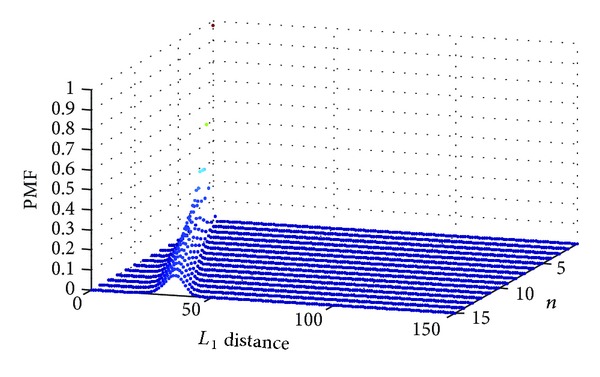
Distribution of random variable R 2 (denoting the minimal L 1 distance from the optimal point for m = 40) for T = 10 and different values of n.
Official websites use .gov
A
.gov website belongs to an official
government organization in the United States.
Secure .gov websites use HTTPS
A lock (
) or https:// means you've safely
connected to the .gov website. Share sensitive
information only on official, secure websites.
Distribution of random variable R 2 (denoting the minimal L 1 distance from the optimal point for m = 40) for T = 10 and different values of n.