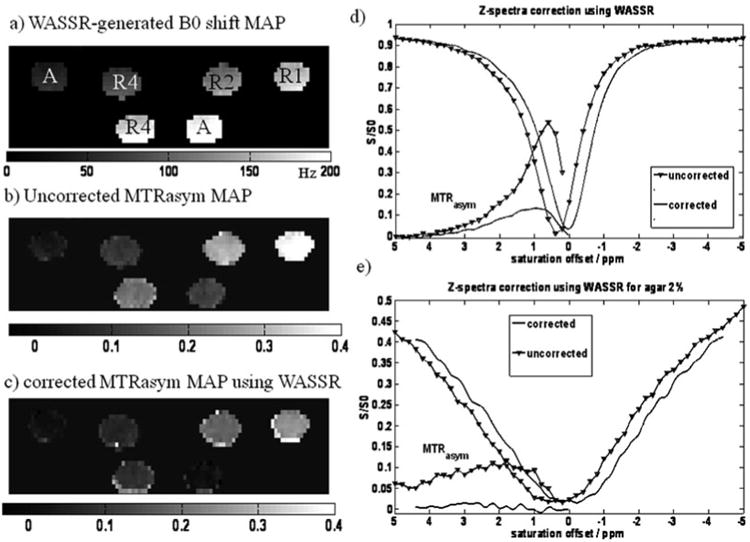
Fig. 4.

An example of B0 correction of CEST images. (a) B0 map derived from WASSR image set with the sample configuration. A: agar 2%, R1, R2, R4 represent 10 mM, 5 mM, 2.5 mM l-arginine in PBS respectively (the B0 shift is displayed for this phantom from 0 to 200 Hz from the carrier frequency). (b) Uncorrected MTRasym map at 1.8 ppm (MTRasym is displayed on a scale from 0 to 0.4) and (c) corrected MTRasym map using as described in Section 3.5.2 (MTRasym is displayed on a scale from 0 to 0.4). (d) Uncorrected and corrected z-spectra and MTRasym curves for the lower R4 sample shown in a–c. (e) Uncorrected and corrected z-spectra and MTRasym curves for the lower agar sample.
