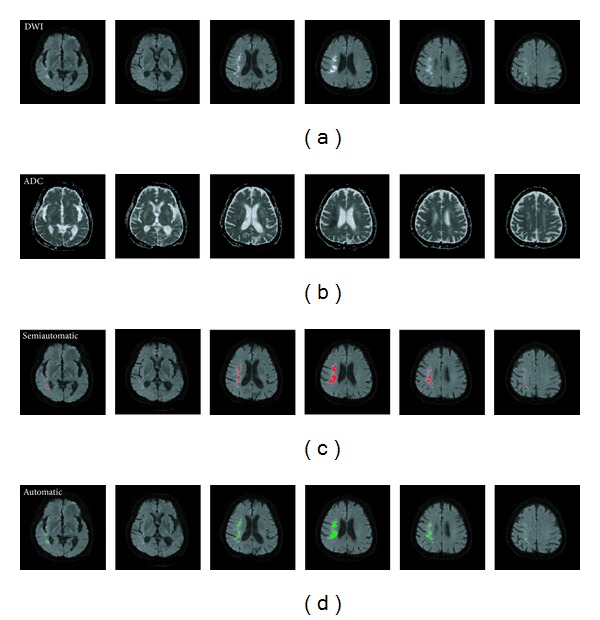
Figure 7.

Illustrating the input and output images of the proposed algorithm using patient number 9 as an example. This figure shows 6 of the 23 slices of the whole-brain MRIs of patient 9. (a) Six axial slices of DWI. (b) Six axial slices of ADC map. (c) Infarct regions, painted red, semiautomatically demarcated by the neurologist. (d) Infarct regions, painted green, detected automatically by the proposed algorithm.
