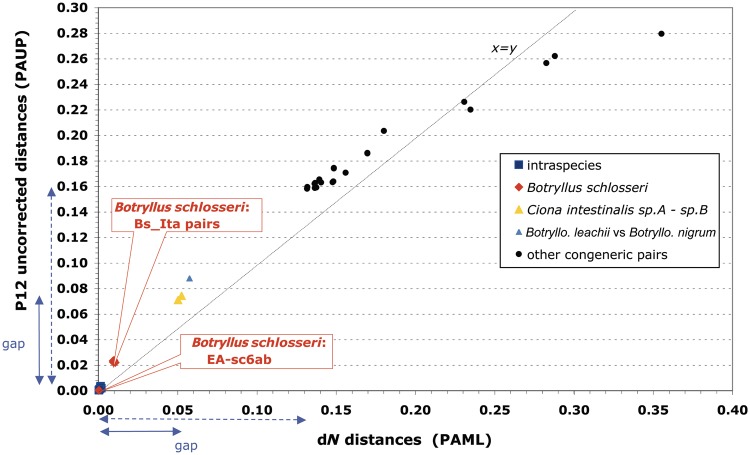
Fig. 3.—
Saturation plot of the first plus second codon positions (P12) of the 13 mitochondrial protein-genes, drawn for all congeneric and intraspecies ascidian pairs. Continuous violet arrowhead lines: gap between intraspecies and all congeneric distances. Dotted violet arrowhead lines: gap between intraspecies and congeneric distances excluding the cryptic Ciona intestinalis and the Botrylloides leachii–Botrylloides nigrum species pairs. The “x = y” line represents the situation where the number of inferred substitutions is equal to the number of observed differences.

