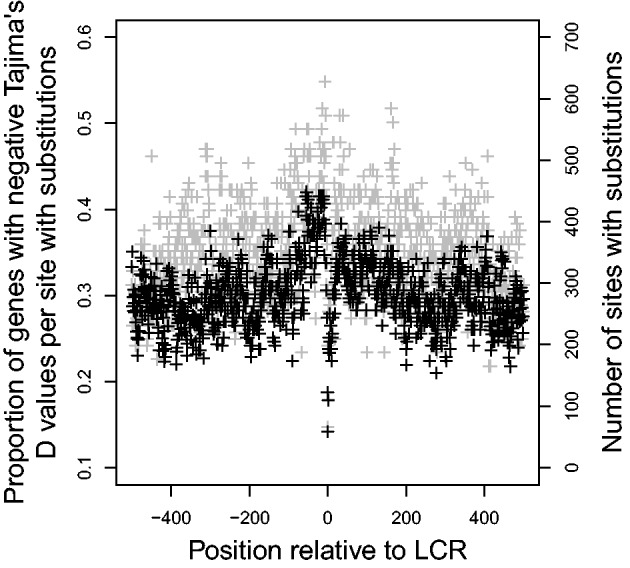
Fig. 6.—

Effect of distance from the LCR on proportion of genes that had negative values for Tajima’s D at each codon. Gray points indicate the number of genes with substitutions that could be used to calculate Tajima’s D at each site. Negative values are upstream of the LCR.
