
Figure 7.
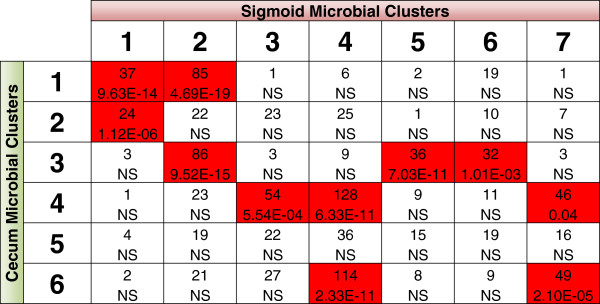
Compositional comparison of cecum and sigmoid microbial clusters. The compositional similarity of microbial clusters between the cecum and sigmoid data was assessed by quantifying overlap of cluster assignment for each operational taxonomic unit (OTU) measured from both colonic regions. The top number in each box is the number of shared OTUs in each corresponding cluster and the bottom number is the P-value, as determined by Fisher’s exact test. Boxes with significant (Bonferroni, P <0.05) overlap are highlighted red. NS, not significant.