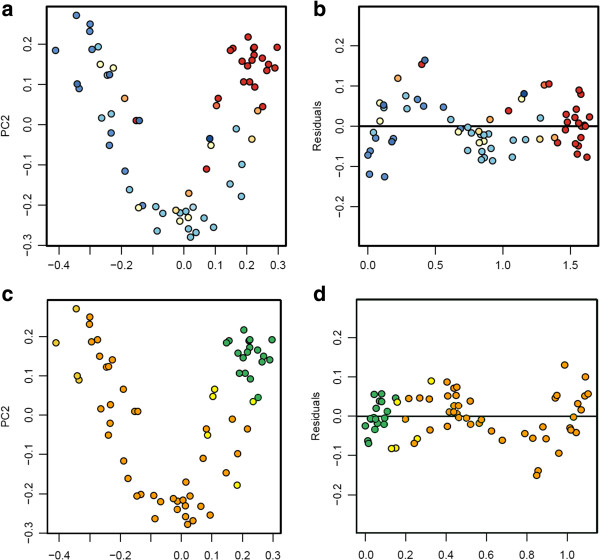
Figure 5.
Unweighted Unifrac principal coordinate analyses (PCoA) of samples at the 200-rarefied level (n = 68), calculated with QIIME. (a) PCoA color-coded by conductivity values (low conductivity: red, average: white, high: blue), and (b) the same plot detrended with QIIME. (c) PCoA color coded by relative air humidity values (high humidity: green, average: yellow, low: orange), and (d) the same plot detrended with QIIME.

