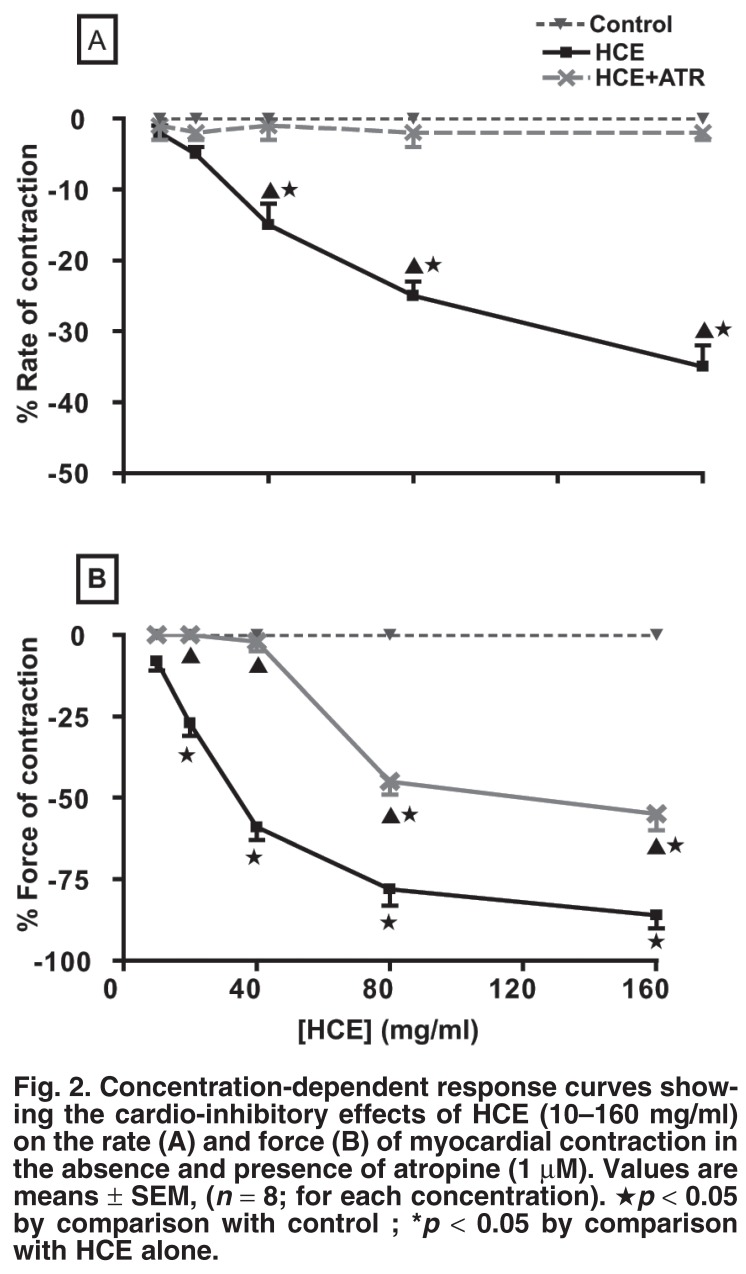
Fig. 2.
Concentration-dependent response curves showing the cardio-inhibitory effects of HCE (10–160 mg/ml) on the rate (A) and force (B) of myocardial contraction in the absence and presence of atropine (1 μM). Values are means ± SEM, (n = 8; for each concentration). ★p < 0.05 by comparison with control ; *p < 0.05 by comparison with HCE alone.

