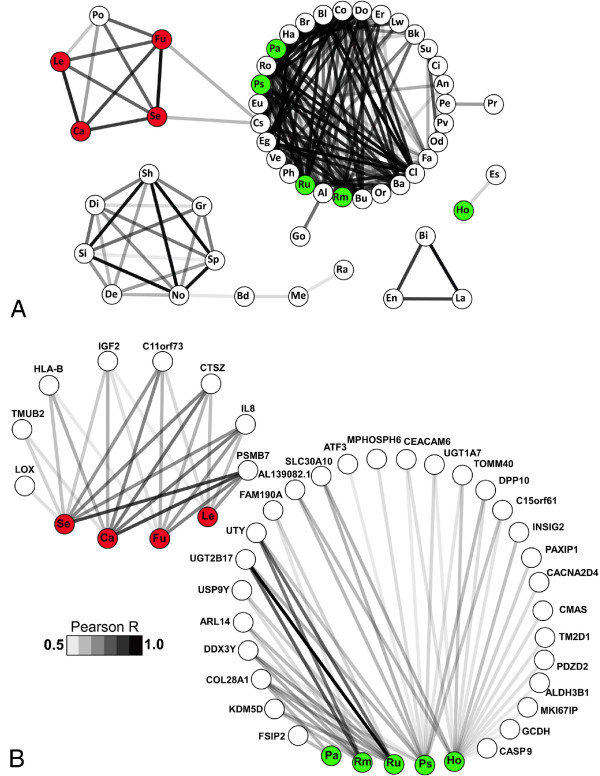
Figure 2.
Bacterial co-occurrence and correlation with host gene expression. (A) The co-occurrence of microbes was inferred by pairwise correlation of sequence counts for all genera in Figure 1. Significance was determined by 1,000 iterations of random re-assignment of sequence read pairs to subjects, with re-calculation of Pearson correlation coefficients. Interactions of significantly differentially abundant genera are illustrated here in a network diagram, constructed using Cytoscape [25]. Pearson R values ranged from a low of 0.51 (Holdemania-Haemophilus) to a high of 0.97 (Fusobacterium-Selenomonas). Each prefix within a node of the network indicates a bacterial genus: Sp: Sphingobium; Sh: Sphingopyxis; Si: Sphingomonas; La: Lactobacillus; Bi: Bifidobacterium; No: Novosphingobium; Se: Selenomonas; Fu: Fusobacterium; Ro: Roseburia; Eg: Eggerthella; Bl: Blautia; Cl: Clostridium; Ve: Veillonella; Ha: Haemophilus; Co: Coprococcus; Ps: Pseudoflavonifractor; Do: Dorea; Ru: Ruminococcus; Bu: Butyrivibrio; Cs: Clostridiales; Ca: Campylobacter; Le: Leptotrichia; Pa: Parabacteroides; Ba: Bacteroides; Rm: Ruminococcaceae; Er: Erysipelotrichaceae; En: Enterococcus; Br: Burkholderia; Ph: Phascolarctobacterium; Lw: Lawsonia; Al: Alistipes; Su: Subdoligranulum; Od: Odoribacter; Po: Porphyromonas; Bk: Burkholderiales; Go: Gordonibacter; Gr: Granulicatella; Di: Dialister; Fa: Faecalibacterium; Eu: Eubacterium; De: Desulfovibrio; Pr: Parvimonas; Pe: Peptostreptococcus; An: Anaerotruncus; Ci: Collinsella; Or: Oribacterium; Ho: Holdemania; Es: Escherichia; Pv: Prevotella; Me: Methylobacterium; Bd: Bradyrhizobium; Ra: Ralstonia. (B) The host factor and microbe interaction was inferred by comparing the relative read pair abundance in the tumor vs. the control samples for each patient. The red and green nodes correspond to microbes with at least nominally significant differential abundance between tumor and control tissues.

