Figure 4.
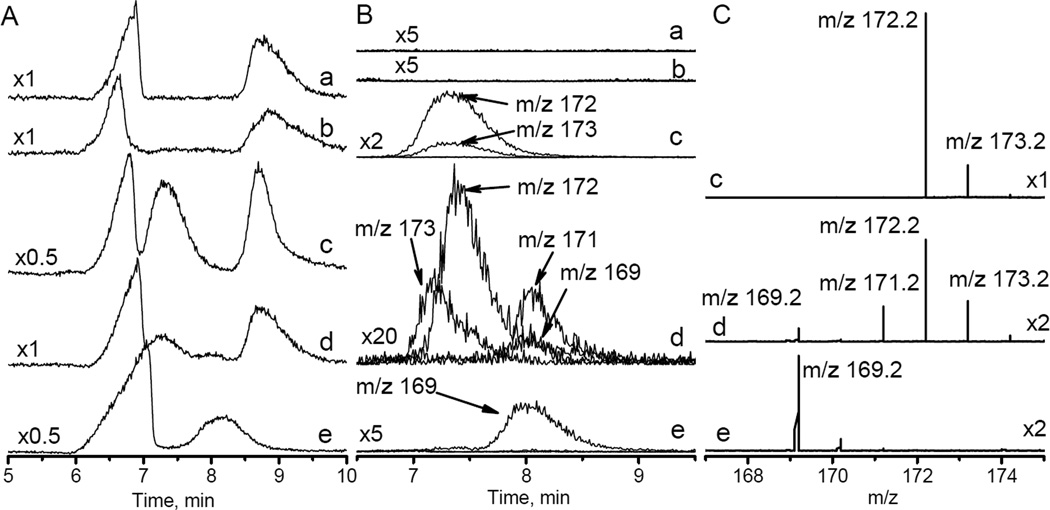
A. HPLC traces obtained for (a) 20 mM Na-phosphate buffer, pH 7.4; (b) same as (a) + 0.5 mM PF; (c) same as (a) + 1 mM HIMD1; (d) same as (a) + 1 mM HIMD1 + 0.5 mM PF incubated for 1 hour at room temperature; (e) same as (a) + 1 mM HIMD1 + 20 mM PF incubated for 10 hours at room temperature. Numbers on the left indicate the relative scale. B. HPLC profiles measured for HIMD1 degradation products with corresponding mass-to-charge ratios (m/z) indicated. Numbers on the left indicate the scale compared to trace (a) in Fig. 4A. Note that asymmetry and small shift of the HPLC peak with m/z=173 for trace (d) compared with trace (c) is presumably due to the presence of hydroxylamine of the HIMD1 in the sample, therefore ionization of both HIMD1 radical and its hydroxylamine may contribute to the HPLC/MS peak with m/z=173. C. ESI mass spectra measured for HPLC peaks in region between 7 min and 8.5 min.

