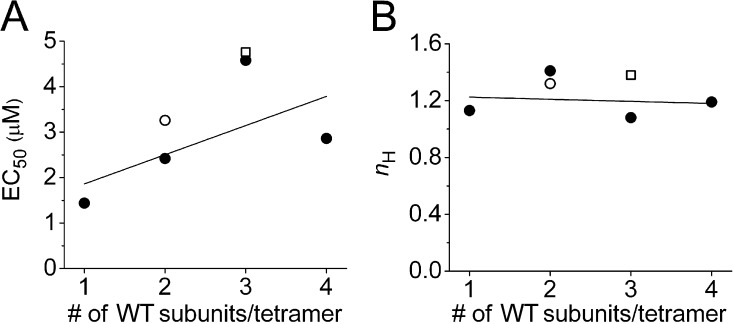
Figure 5.
The concentration response relationship for PD-induced increase in Itail is not dependent on the number of WT subunits in a concatenated tetramer. (A) Plot of EC50 as a function of the number of WT subunits in a tetramer. Line represents linear fit to data: y = 0.64x + 1.22 (adjusted R2 = 0.099). (B) Plot of nH as a function of number of WT subunits in a tetramer. Line represents linear fit to data: y = −0.015x + 1.24 (adjusted R2 = −0.473). In both panels, the open circle represents LE1/WT1/LE1/WT1 channels; the open square represents WT3/LE1 channels.

