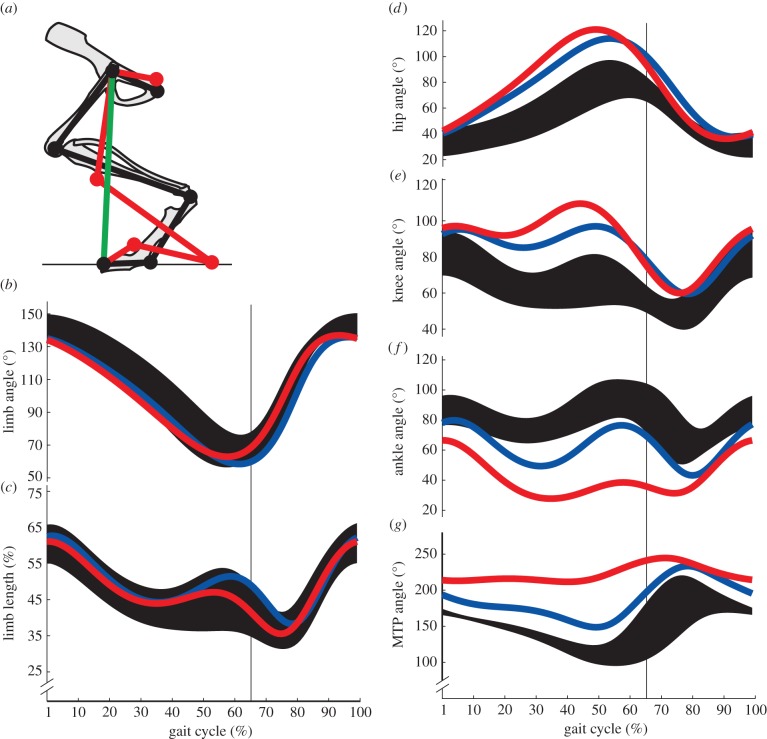
Figure 1.
(a) Representative data depicting sagittal plane kinematics model of the rat hindlimb. Limb segments of control (black) and severe PNI injury (red) rats are depicted during mid-stance sharing a common limb vector (green). (b) Mean limb angle, (c) limb length, (d) hip, (e) knee, (f) ankle and (g) MTP joint angle trajectories plotted over a normalized gait cycle. Control data (black, n = 15) are represented by ±1 s.d. about the mean and compared with mean trajectories after moderate (blue, n = 10) and severe (red, n = 9) triceps surae injuries. Vertical bars represent stance-to-swing transition.

