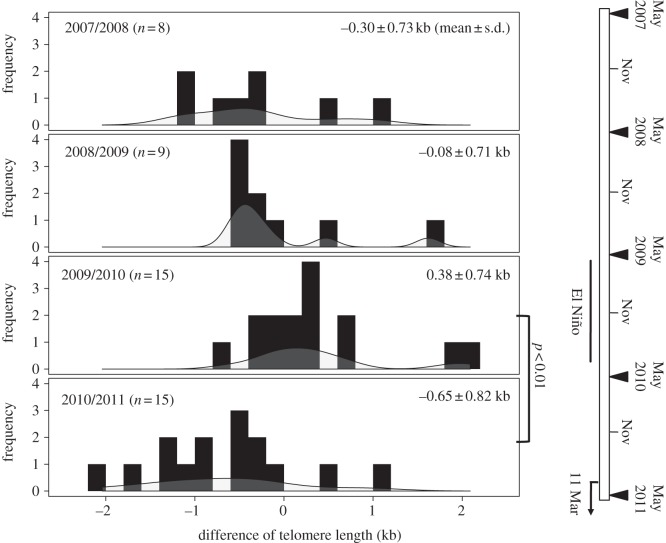
Figure 1.
Frequency distribution of the rate of telomere change between each year included in the study. Each solid line indicates the density distribution. The right panel shows the chronology of major events that were likely to affect the behaviour and physiology of the gulls: the bars represent the El Niño events from summer 2009 to spring 2010 [15] and the Great Japan Earthquake and subsequent massive tsunami on 11 Mar 2011. The triangles represent sampling dates.

